 d
d
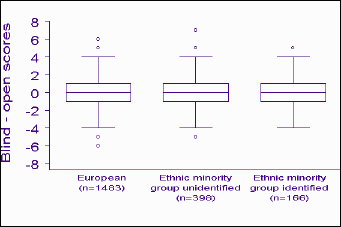
The graph shown does make any connection between the paired scores on the blinded and open forms. One possibility would be to plot the differences between masked and open, like this:
Several other approaches could be used, but there are too many points for scatter diagrams.
This page maintained by Martin Bland.
Last updated: 8 April, 2004.