 d
d
We have already seen that male students had a significantly bigger mean head circumference than female students (Week 4 Exercise: Head circumference) and also that, for females, head circumference and height were related (Week 7 Exercise: Head circumference and height). Could it be that the difference in head circumference between the sexes is explained by the difference in height?
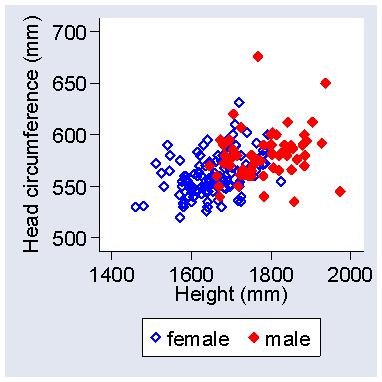
The following graph shows a plot of head circumference against height for males and females:
1. What method could we use to answer the question: is the difference in head circumference between the sexes explained by the difference in height?
Head (mm) = 396 + 0.0957 × height (mm) + 6.80 × sex
where sex = 1 for a female, 2 for a male.
2. What does 6.80 tell us?
We can add confidence intervals and P values for the coefficients in this equation:
Head (mm) = 396
+ 0.0957 × height (mm) + 6.80 × sex
95% CI 334 to 459
0.0555 to 0.1360 -1.1 to 14.6
P<0.001
P<0.001
P=0.09
3. What can we conclude from this analysis?
These are the histogram and Normal plot for the residuals, as shown in Answer 4:
5. What can we conclude from these distribution graphs?
This is the scatter plot of the residuals against the value predicted by the regression equation, as shown in Answer 4:
6. What can we conclude from the scatter diagram?
8. How could we check the assumption of linearity?
To Clinical Biostatistics index.
To Martin Bland's M.Sc. index.
This page maintained by Martin Bland.
Last updated: 20 March, 2007.