Sketch graphs of the following lines: y = x, y = 2 + 0.5x, y = 5 – x.
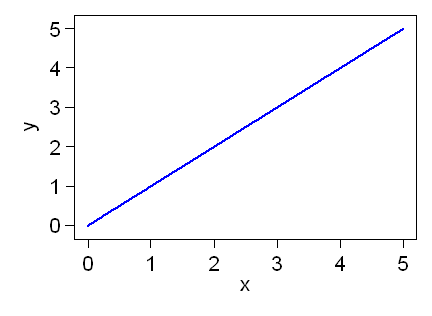
For y = x, the slope is 1 and the intercept is 0. The line goes through (0,0) and y increases by 1 for every increase of 1 in x. Your graph should look something like this:

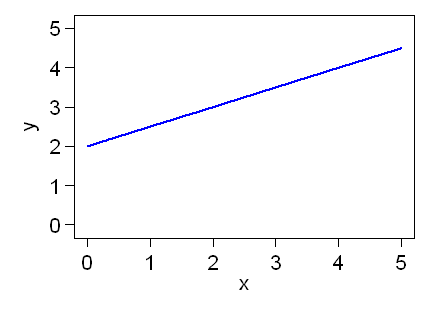
For y = 2 + 0.5x, the slope is 0.5 and the intercept is 2. The line goes through (0,2) and y increases by 0.5 for every increase of 1 in x. Your graph should look something like this:

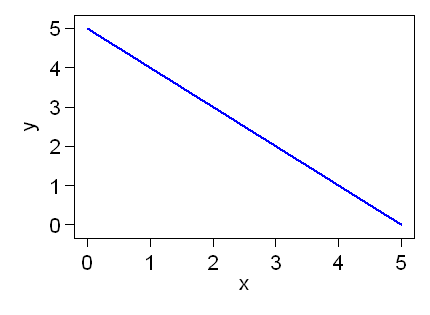
For y = 5 – x, the slope is –1 and the intercept is 5. The line goes through (0,5) and y decreases by 1 for every increase of 1 in x. Your graph should look something like this:

To Martin Bland's M.Sc. index.
This page maintained by Martin Bland.
Last updated: 2 October, 2007.