Decomposing
the P/E
This sounds (and in fact
is) quite a complicated procedure, but the idea behind it is very simple. Take
any company and ask yourself, "What is the P/E I would expect this company to
have?" If the P/E the company actually has is less than you would expect, this
must be a good sign.
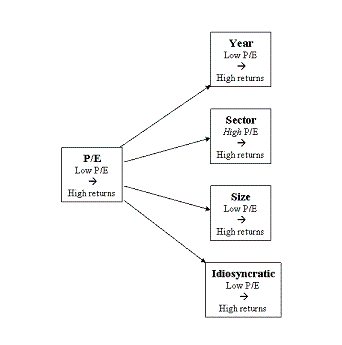
It's well known that
the overall P/E of the market goes up and down over the years. Certain sectors
such as technology stocks traditionally have higher P/E's than, say, the Water
sector. And finally, large companies generally have higher P/E's than smaller
companies, even in the same sector. For the decomposed
P/E [link to academic paper] I extracted each of these factors
from the original P/E, ran a regression and weighted them according to how powerful
they are in predicting returns.
 Generally
of course the higher the P/E the worse the future returns, but this isn't always
the case. High-growth, high P/E sectors actually do perform slightly better
over the years than low-growth, low P/E sectors. I take this factor out and
reverse it. Up to now it has been working against us, making
the P/E less powerful at predicting returns: now it is working for us.
The results are startling:
using eight years of past earnings and decomposing the P/E gives a new statistic
more than three times as powerful as the traditional P/E. There is a difference
of over 20% between returns on portfolios of low decomposed P/E shares and high
decomposed P/E. The one-tenth of shares with the lowest P/E would have returned
32% average per year since 1975 (mid-mid,
annual rebalancing).
Fund managers who think
that this sounds interesting should look here.
Private investors who want to supercharge their returns and don't mind taking
on some extra risk in a concentrated portfolio can go on to look at the
naked P/E.
 Generally
of course the higher the P/E the worse the future returns, but this isn't always
the case. High-growth, high P/E sectors actually do perform slightly better
over the years than low-growth, low P/E sectors. I take this factor out and
reverse it. Up to now it has been working against us, making
the P/E less powerful at predicting returns: now it is working for us.