 d
d
| Subject 1 | Subject 2 | Subject 3 | Subject 4 | |||||
|---|---|---|---|---|---|---|---|---|
| X | Y | X | Y | X | Y | X | Y | |
| 47 | 51 | 49 | 52 | 51 | 46 | 63 | 64 | |
| 46 | 53 | 50 | 56 | 46 | 48 | 70 | 62 | |
| 50 | 57 | 42 | 46 | 46 | 47 | 63 | 66 | |
| 52 | 54 | 48 | 52 | 45 | 55 | 58 | 64 | |
| 46 | 55 | 60 | 53 | 52 | 49 | 59 | 62 | |
| 36 | 53 | 47 | 49 | 54 | 61 | 61 | 62 | |
| 47 | 54 | 51 | 52 | 48 | 53 | 67 | 58 | |
| 46 | 57 | 57 | 50 | 47 | 48 | 64 | 62 | |
| 36 | 61 | 49 | 50 | 47 | 50 | 59 | 67 | |
| 44 | 57 | 49 | 49 | 54 | 44 | 61 | 59 | |
| Mean | 45.0 | 55.2 | 50.2 | 50.9 | 49.0 | 50.1 | 62.5 | 62.6 |
| Correlation | r=-0.33 | r=0.49 | r=0.06 | r=-0.39 | ||||
| Significance | P=0.35 | P=0.15 | P=0.86 | P=0.27 | ||||
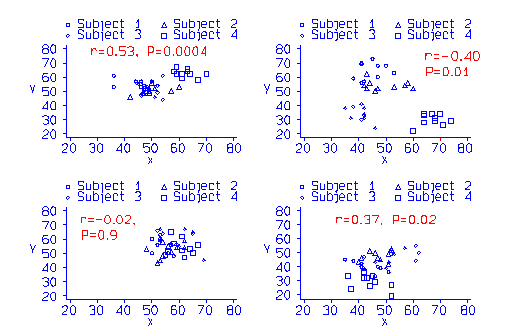
Consider the simulated data in the Table. The data were generated from random numbers, and there is no relationship between X and Y at all. First values of X and Y were generated for each `subject', then a further random number was added to make the individual `observation'. For each subject separately, there was no significant correlation between X and Y. For the subject means, the correlation coefficient was r = 0.77, P = 0.23. However, if we put all 40 observations together we get r = 0.53, P = 0.0004. Even though the coefficient is smaller than that between means, because it is based on 40 pairs of observations rather than 4 it becomes significant.
The data are plotted in the figure below, with three other simulations:
As the null hypothesis is always true in these simulated data, the correlations for each `subject' and for the means are not significant. Because the numbers of observations are small, they vary greatly. Large correlation coefficients can arise by chance in small samples. However, the overall correlation is `significant' in three of the four simulations, though in different directions.
We only have four subjects and only four points. By using the repeated data, we are not increasing the number of subjects, but the statistical calculation is done as if we have, and so the number of degrees of freedom for the significance test is incorrectly increased and a spurious significant difference produced.
There are two simple ways to approach this type of data, and which is chosen depends on the question being asked. If we want to know whether subjects with a high value of X tend to have a high value of Y also, we use the subject means and find the correlation between them. If we have different numbers of observations for each subject, we can use a weighted analysis, weighted by the number of observations for the subject. If we want to know whether changes in one variable in the same subject are parallelled by changes in the other, we need to use multiple regression, taking subjects out as a factor (S17.1, S17.6). In either case, we should not mix observations from different subjects indiscriminately.
Back to An Introduction to Medical Statistics contents.
Back to Martin Bland's Home Page.
This page maintained by Martin Bland.
Last updated: 17 October, 2003.