 D
D
In this case we could not simply replace a measurement by one method with a measurement by the other, as they are not measuring the same quantity. Hence the limits of agreement approach does not apply.
We could predict what the measurement by the old method would be given the measurement by the new method. If this prediction agrees well with the actual measurement by the old method, then the two methods give similar information and we could replace the new by the old.
We start by regressing the measurement by the old method on the measurement by the new. We can use this regression equation to estimate a predicted old method measurement for any observed value by the new method. Of course, this will gives the mean old method value for subjects with this new method value; it does not take the variation between subjects into account. We take this in account by calculating a range of possible values for the old method value on this subject, called a 95% prediction interval. You can then say for any observed test value an interval within which the gold standard would be with probability 95%. This gives us something akin to the limits of agreement. The width of the prediction interval is not constant, being smallest near the middle of the range and wider as we get further towards the extremes. This effect is quite marked for small samples, but not for large. These prediction intervals form curves about the regression line.
This is very similar to the limits of agreement approach, except that the limits vary with the estimate.
For an example, here are two different measures of lung function, Peak Expiratory Flow (PEF), measured in litres per minute, and Forced Expiratory Volume in 1 second (FEV), measured in litres. Could we use PEF, which is easier to measure, instead of FEV?
| PEF (l/min) | FEV (l) |
|---|---|
| 327.3 | 2.72 |
| 439.0 | 2.91 |
| 509.7 | 2.84 |
| 513.0 | 3.99 |
| 552.6 | 5.01 |
| 612.0 | 4.43 |
| 619.3 | 4.46 |
| 642.3 | 3.65 |
| 643.6 | 4.57 |
| 678.3 | 5.71 |
| 679.3 | 5.53 |
| 698.6 | 4.31 |
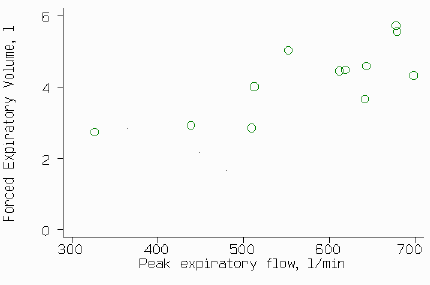
Of course, this sample is too small for practical use, but it makes a useful illustration of the method. We can plot one against the other:
but we cannot plot difference against mean, as they are in different units. Instead, we can carry out linear regression. This give a regression line
FEV = 0.236 + 0.00684 PEF
which we can plot on the scatter diagram:
This regression line gives us the best prediction of FEV from PEF. We now need to know how good this prediction is. The standard error of the predicted FEV for an individual is

where x is the observed PEF for a new subject and n,  ,
,  and
and
 are
the number of observations, mean PEF, ith PEF, and variance about the
line for the training sample.
We can calculate the 95% limits for the prediction by the regression line +/- 1.96 standard errors. These can be added to the scatter plot:
The 95% limits are not straight lines and not parallel, but it will usually be the case that the curvature is slight within the range of the observations. Here we could use the central value of the standard error, when PEF = 576.25 (the mean), which is 0.704 litres, to calculate an approximate limit by
lower limit = 0.236 + 0.00684 PEF - 1.96 times 0.704 = -1.144 + 0.00684 PEF
upper limit = 0.236 + 0.00684 PEF + 1.96 times 0.704 = 1.616 + 0.00684 PEF
We estimate that the FEV predicted from the PEF will be within 1.96 times 0.704 = 1.4 litres of the FEV which would be measured directly.
These prediction limits are very similar to 95% limits of agreement. If the 95% prediction interval has the width which we would find acceptable in the 95% limits of agreement, we could switch to the new method of measurement. As with the limits of agreement method itself, what constitutes acceptable agreement is a clinical question, not a statistical one. Ideally, a decision as to what amount of disagreement would be acceptable should be made before the study is carried out.
Back to frequently asked questions on the design and analysis of measurement studies.
Back to measurement studies menu.
Back to Martin Bland's home page.
This page maintained by Martin Bland.
Last updated: 16 April, 2004.