 d
d
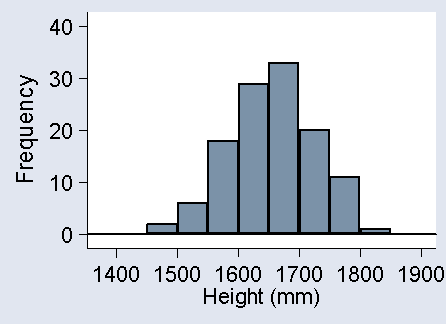
The following graph shows the distribution of the heights of 120 female biomedical sciences, medical, nursing, physiotherapy, and radiography students:
1. What kind of variable is height?
2. What kind of graph is this?
3. Where are the mode, the lower tail and the upper tail of this distribution?
Check suggested answer 3.
4. How would you describe the shape of the distribution and why?
5. From the graph, approximately what would you estimate the median and the first and third quartiles to be? Where would they appear along the horizontal axis?
6. From the graph, approximately what would you estimate the mean and the standard deviation to be? Where would they appear along the horizontal axis?
To Clinical Biostatistics index.
To Martin Bland's M.Sc. index.
This page maintained by Martin Bland.
Last updated: 21 July, 2006.