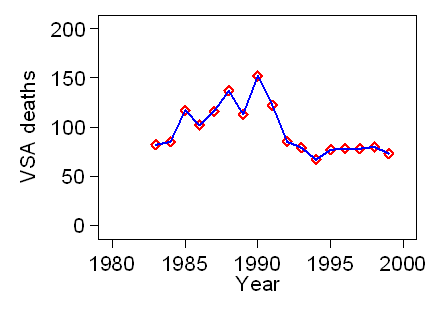
Sketch a line graph to show the numbers of deaths associated with volatile substance abuse (VSA) in the UK between 1983 and 1999:
| Year | VSA deaths |
|---|---|
| 1983 | 82 |
| 1984 | 85 |
| 1985 | 117 |
| 1986 | 102 |
| 1987 | 116 |
| 1988 | 137 |
| 1989 | 113 |
| 1990 | 152 |
| 1991 | 122 |
| 1992 | 85 |
| 1993 | 79 |
| 1994 | 67 |
| 1995 | 77 |
| 1996 | 78 |
| 1997 | 78 |
| 1998 | 80 |
| 1999 | 73 |
Your graph should look something like this:

Or you could omit the points and just show the lines:

To Martin Bland's M.Sc. index.
This page maintained by Martin Bland.
Last updated: 2 October, 2007.