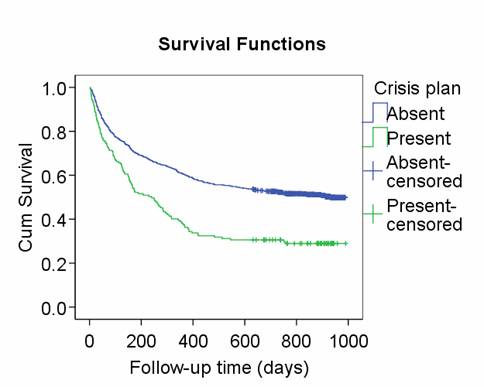
Question 3: Plot the survival for children discharged with and without a crisis plan and test the null hypothesis that readmission is unrelated to the presence of a crisis plan.
As before, we use Analyze, Survival, Kaplan-Meier. The time variable is "Follow-up time (days)" and the Status variable is "Readmitted". We define the event as "1", the code for a readmission. We go to Options and check Plots Survival.
We want to draw the plot for those with and without a crisis plan. We put "Crisis plan" into Factor.
We want to test the null hypothesis that readmission is unrelated to the presence of a crisis plan. To do this we click Compare Factor and choose Log rank.
Now we are ready, so Continue, OK.
We get the following curves, after a little improvement:

There appears to be a large difference. Rather disturbingly, the present of a crisis plan appears to increase the risk of readmission!
We get the following output from the log-rank test:
| Overall Comparisons | |||
|---|---|---|---|
| Chi-Square | df | Sig. | |
| Log Rank (Mantel-Cox) | 32.480 | 1 | .000 |
| Test of equality of survival distributions for the different levels of Crisis plan. | |||
The difference is highly significant, too, P < 0.001.
Back to Exercise: Readmission to hospital for asthmatic children.
To Biostatistics in Research Practice index.
To Martin Bland's M.Sc. index.
This page maintained by Martin Bland.
Last updated: 5 April, 2007.