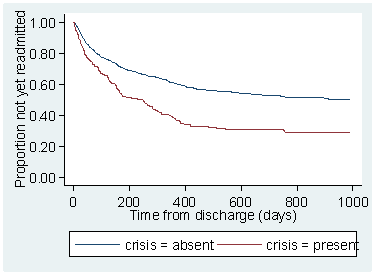
Question 3: Plot the survival for children discharged with and without a crisis plan and test the null hypothesis that readmission is unrelated to the presence of a crisis plan.
We add by (crisis) to the sts graph command:
. sts graph, by( crisis) xtitle("Time from discharge (days)") ylabel(0 (.2) 1, angle(horiz)
   nogrid) ytitle(Proportion not yet readmitted) title("") scale(1.5)

I would like to improve this a bit. The two survival curves would be hard to distinguish for someone who is colour blind. I would like one of them to be a dashed line, for which I can use clpattern(solid dash). We have to give the patterns for all the connect lines in the graph. I would also like different colours. Most people can see red differently from blue, so I use clcolor(red blue). I would like a better legend at the bottom. I can write my own using legend and label(1 "No crisis plan") and label(2 "Crisis plan") will give the legends for the two survival curves. I would like to put "Crisis plan" first, so I switch the order with order(2 1):
. sts graph, by(crisis) clpattern(solid dash) clcolor(red blue) xtitle("Time from discharge (days)")
ylabel(0 (.2) 1, angle(horiz) nogrid) ytitle(Proportion not yet readmitted)
title("") legend(order(2 1) label(1 "No crisis plan") label(2 "Crisis plan")) scale(1.5)

It takes a long time to remember all these commands and we don't try. Just use the help files to remind you what they should be to get what you want.
There appears to be a large difference. Rather disturbingly, the present of a crisis plan appears to increase the risk of readmission!
We want to test the null hypothesis that readmission is unrelated to the presence of a crisis plan. To do this we use sts test:
. sts test crisis

         failure _d:  readmit
   analysis time _t:  time


Log-rank test for equality of survivor functions

        |   Events         Events
crisis  |  observed       expected
--------+-------------------------
absent  |       428         471.63
present |       111          67.37
--------+-------------------------
Total   |       539         539.00

              chi2(1) =      32.48
              Pr>chi2 =     0.0000
The difference is highly significant, too, P < 0.001.
Back to Exercise: Readmission to hospital for asthmatic children.
To Biostatistics in Research Practice index.
To Martin Bland's M.Sc. index.
This page maintained by Martin Bland.
Last updated: 6 February, 2008.