 D
D
Question 1: Why was the logarithmic transformation of the data used?
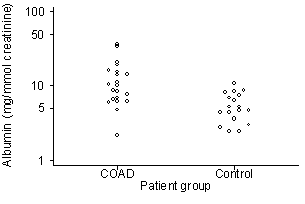
From the figure we can see that the albumin data have skew distributions, with a few observations much greater than the rest. The variability is also much greater in the COAD patients where the mean is higher. Using a logarithmic scale (see figure below) stretches the bottom of the scale and compresses the top, making the distribution more like the Normal.
The log transformation also makes the variances more uniform. The transformed data matches the assumptions of the t test more closely.
Back to Exercise: Transformations.
This page maintained by Martin Bland.
Last updated: 27 July, 2009.