 D
D
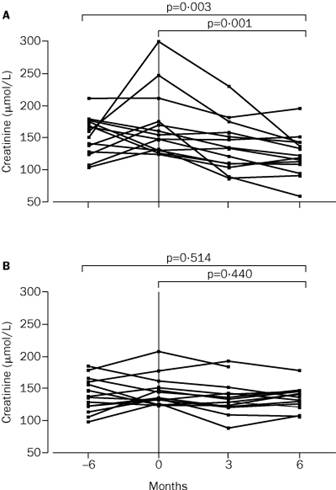
Liver transplant patients require drugs to suppress their immune systems and prevent rejection of the new liver. Renal dysfunction is a major complication of long-term immunosuppressive therapy with calcineurin inhibitors (CNI). In this study, 28 people who had had renal dysfunction attributable to suspected CNI toxicity were randomised to either replacement of CNI with mycophenolate mofetil (study patients, group A); or to remain on CNI immunosuppression (controls, group B). Renal function, blood pressure, uric acid, and blood lipids were measured before and 6 months after study entry (Schlitt et al., 2001).
The following figure was given:
The authors report: At the end of the study, mean (SD) serum creatinine had fallen by 44.4 (48.7) µmol/L in study patients compared with 3.1 (14.3) µmol/L in controls; a mean difference of 41.3 µmol/L (95% CI 12.4-702).
In a study of factors predicting male fertility, conventional semen indices were measured in donors to an artificial insemination clinic. By evaluating the pregnancies that resulted, donors could be graded as to their fertility. The aim was see whether any of these factors could be used as a test for high fertility.
Two sample t tests were carried out comparing the means of the variables between the two groups. No significant differences were found in semen indices between successful and unsuccessful donors.
| Successful donors | Unsuccessful donors | |||||
|---|---|---|---|---|---|---|
| No. | Mean | (SD) | No. | Mean | (SD) | |
| Volume (ml) | 17 | 3.14 | (1.28) | 19 | 2.91 | (0.91) |
| Semen count (106/ml) | 18 | 146.4 | (95.7) | 19 | 124.8 | (81.8) |
| % motility | 17 | 60.7 | (9.7) | 19 | 58.5 | (12.8) |
| % abnormal morphology | 13 | 22.8 | (8.4) | 16 | 20.3 | (8.5) |
The study concluded that conventional semen analysis may be too insensitive an indicator of fertility potential to enable us to predict which individuals will provide useful sperm donations (Paraskevaides et al., 1991).
Paraskevaides, E.C., Pennington, G.W., Naik, S., and Gibbs, A.A. (1991) Pre-freeze/post-freeze semen motility ratio. Lancet 337, 366-7.
Schlitt HJ, Barkmann A, Boker KHW, Schmidt HHJ, Emmanouilidis N, Rosenau J, Bahr MJ, Tusch G, Manns MP, Nashan B, Klempnauer J. (2001) Replacement of calcineurin inhibitors with mycophenolate mofetil in liver-transplant patients with renal dysfunction: a randomised controlled study. Lancet 357, 587-591.
To Introduction to Statistics for Research index.
This page maintained by Martin Bland.
Last updated: 13 January, 2020.