Graphs of the electricity generation statistics gathered from our solar PV generation system.
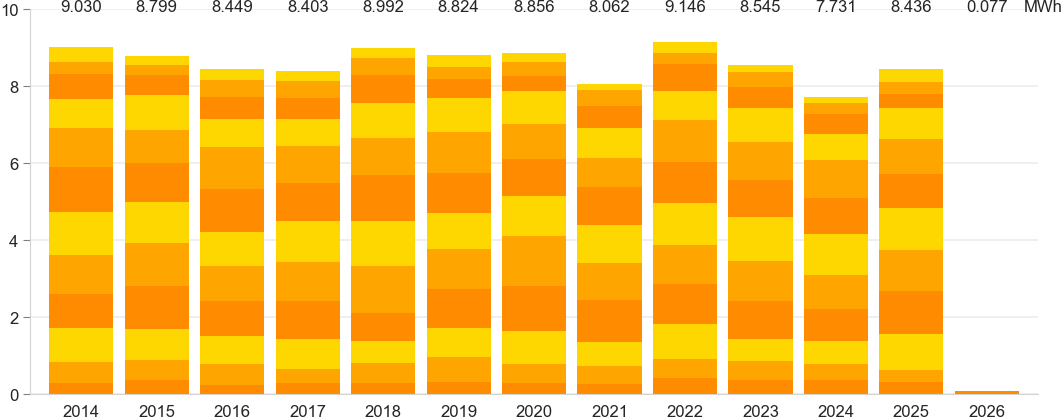
Our cumulative annual power generation in MWh (bars), with shading indicating the contribution of the respective months. (Generation started on 9 Jan 2014.)
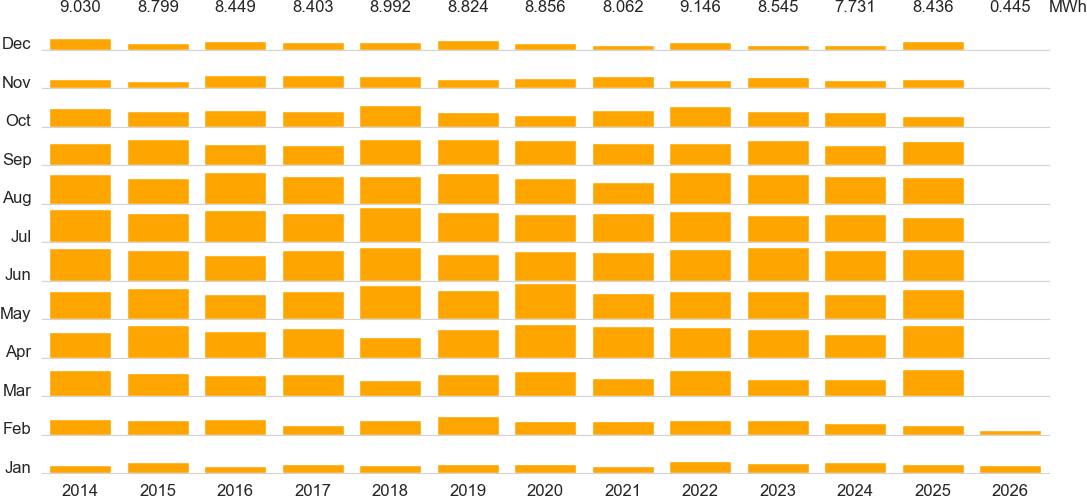
Our annual power generation in MWh, with each month’s contribution base-aligned, to allow comparison across months. (Generation started on 9 Jan 2014.)
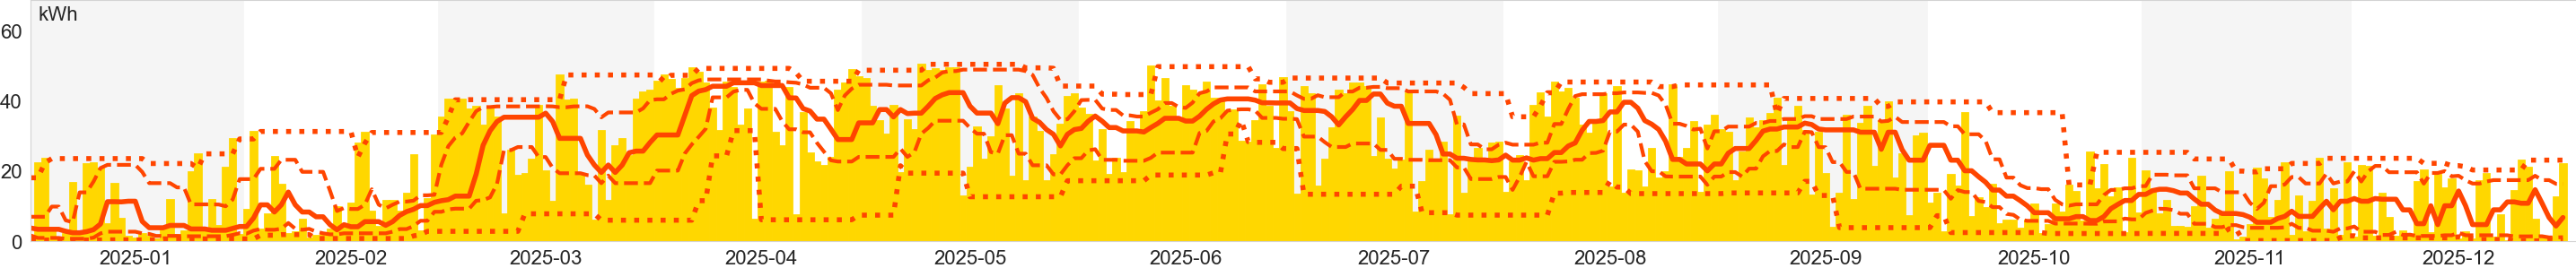
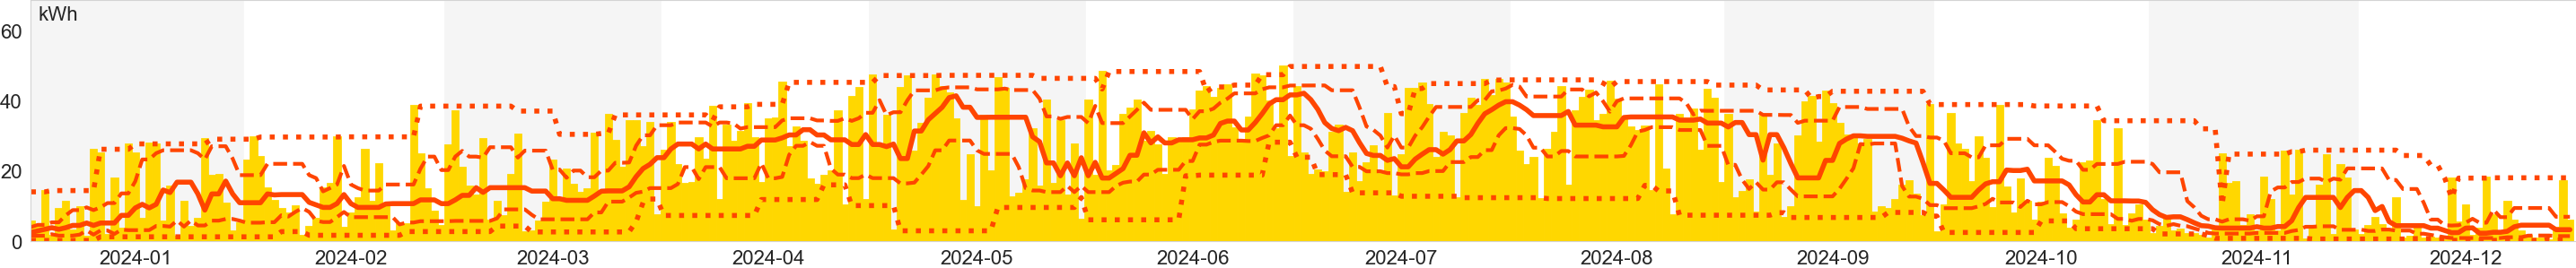
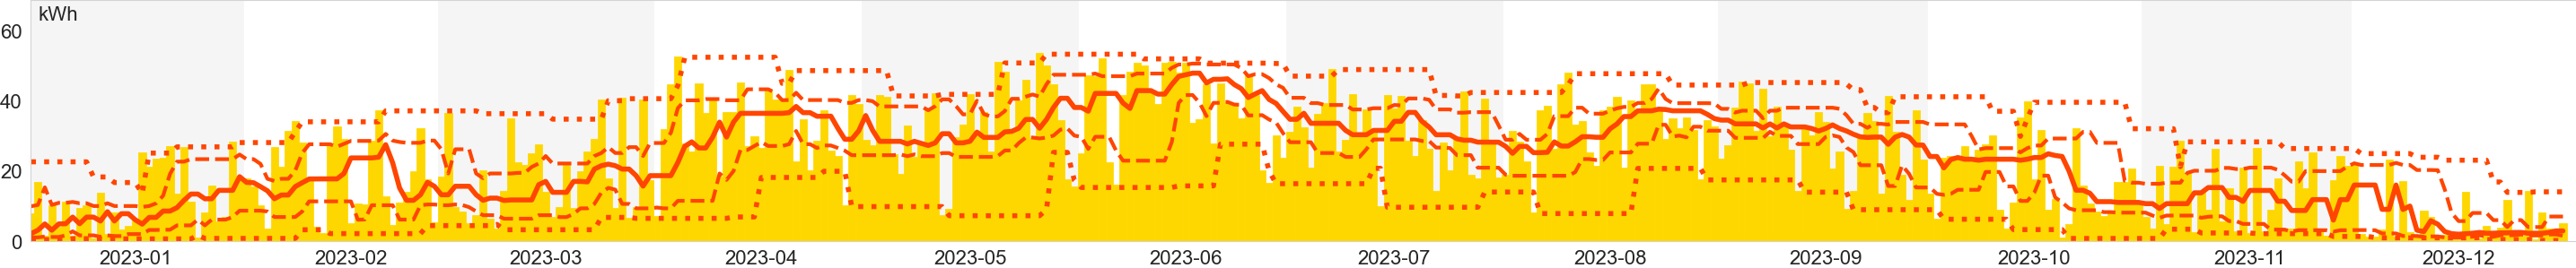
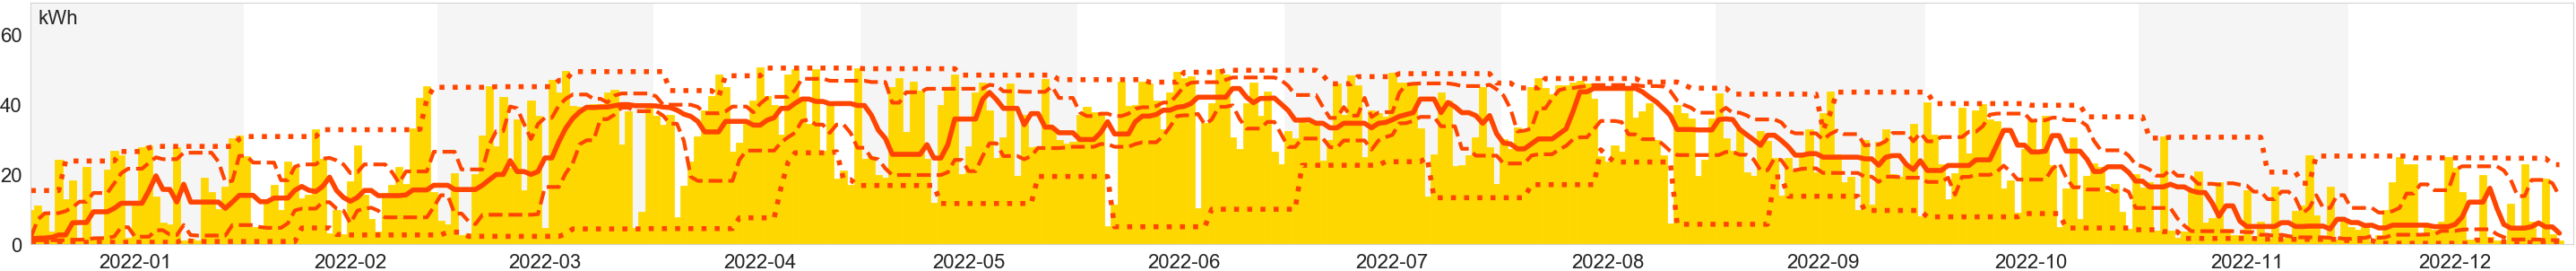
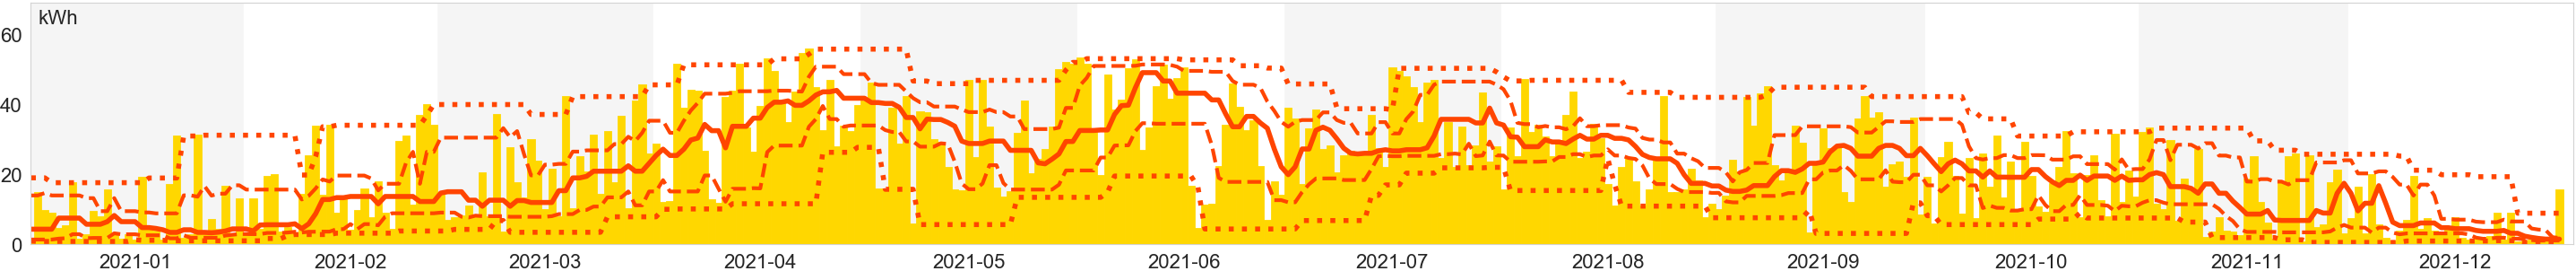
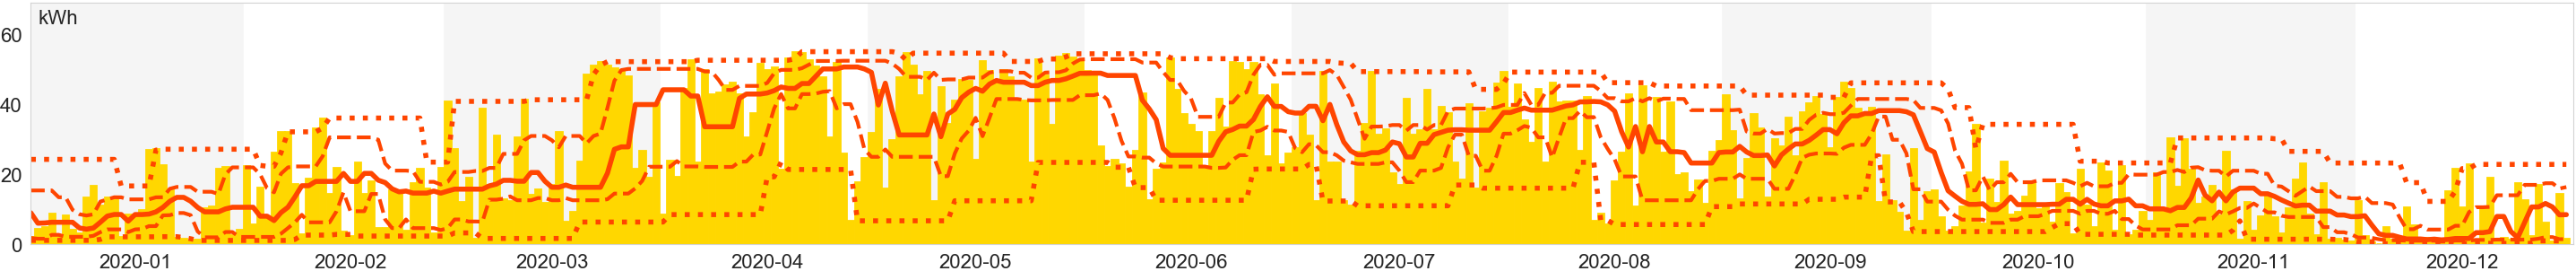
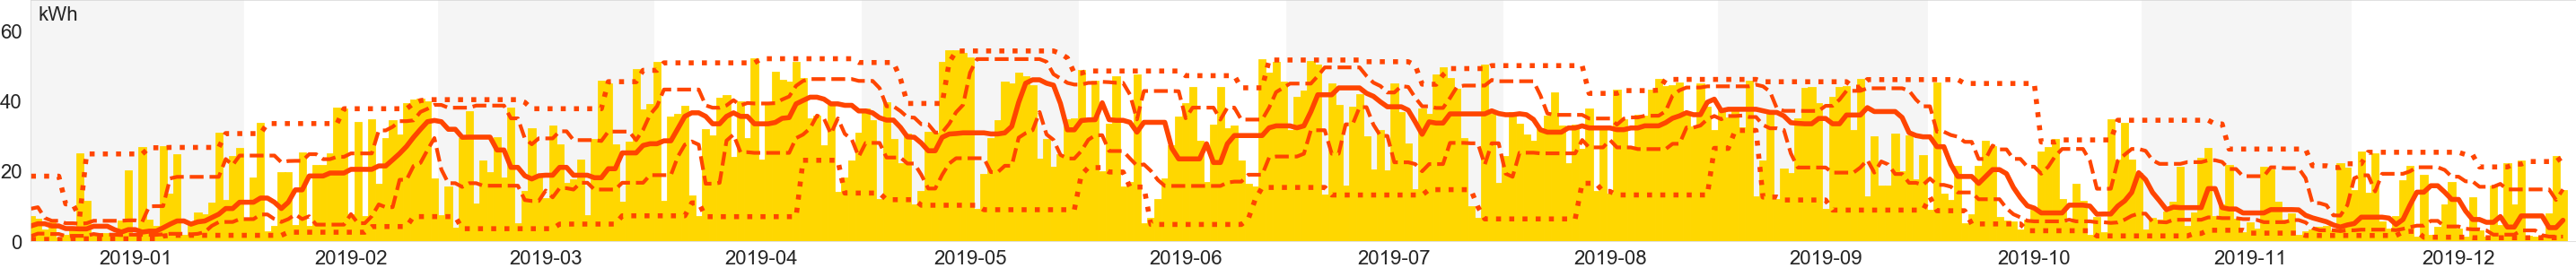
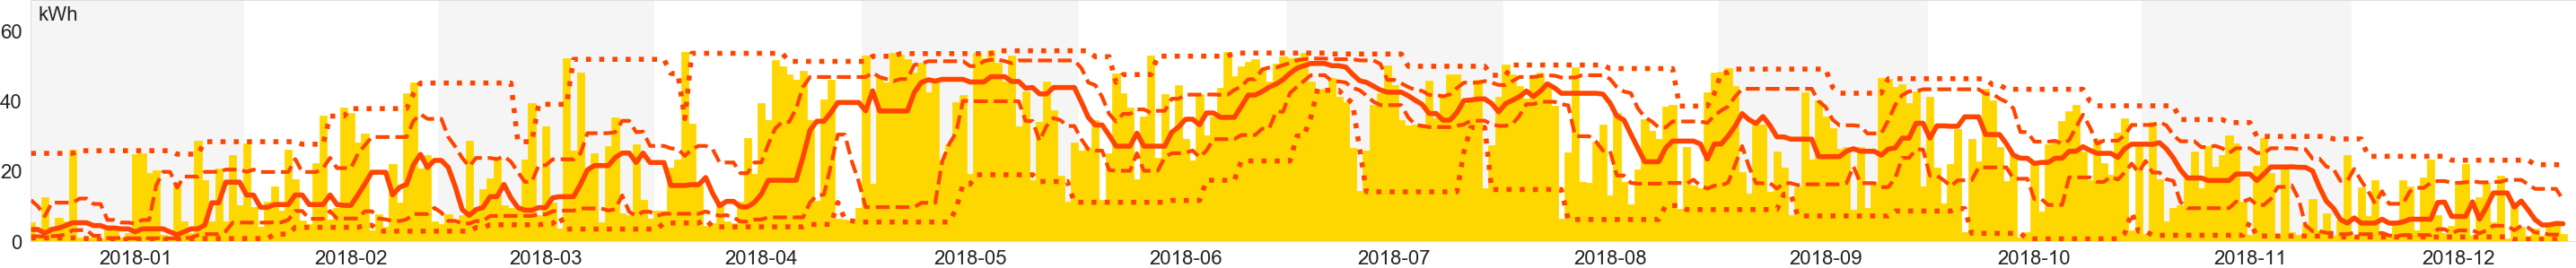
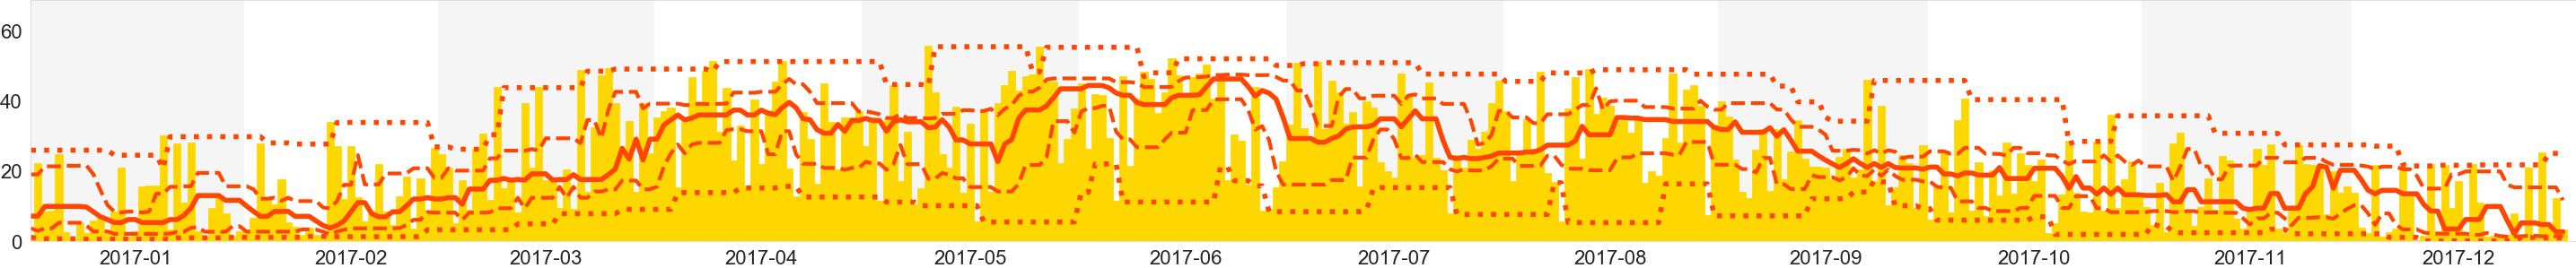
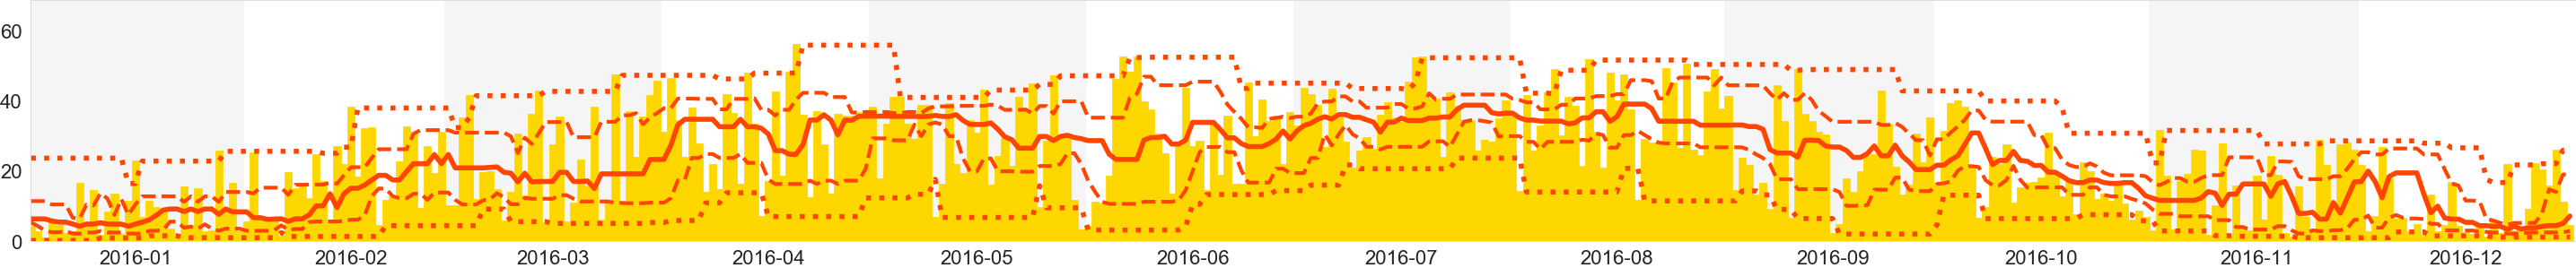
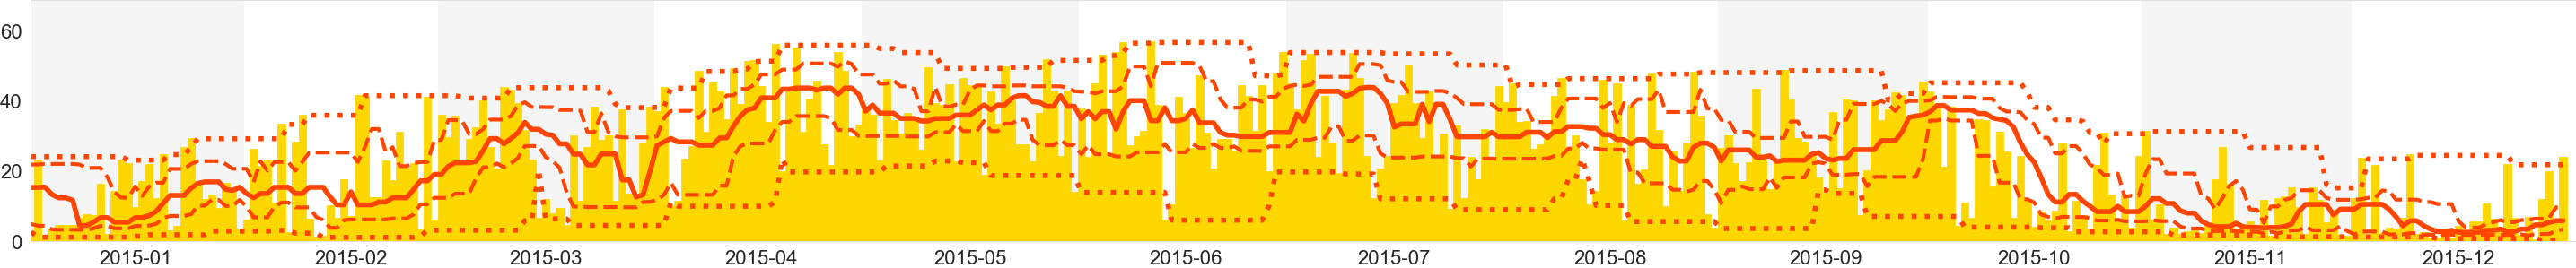
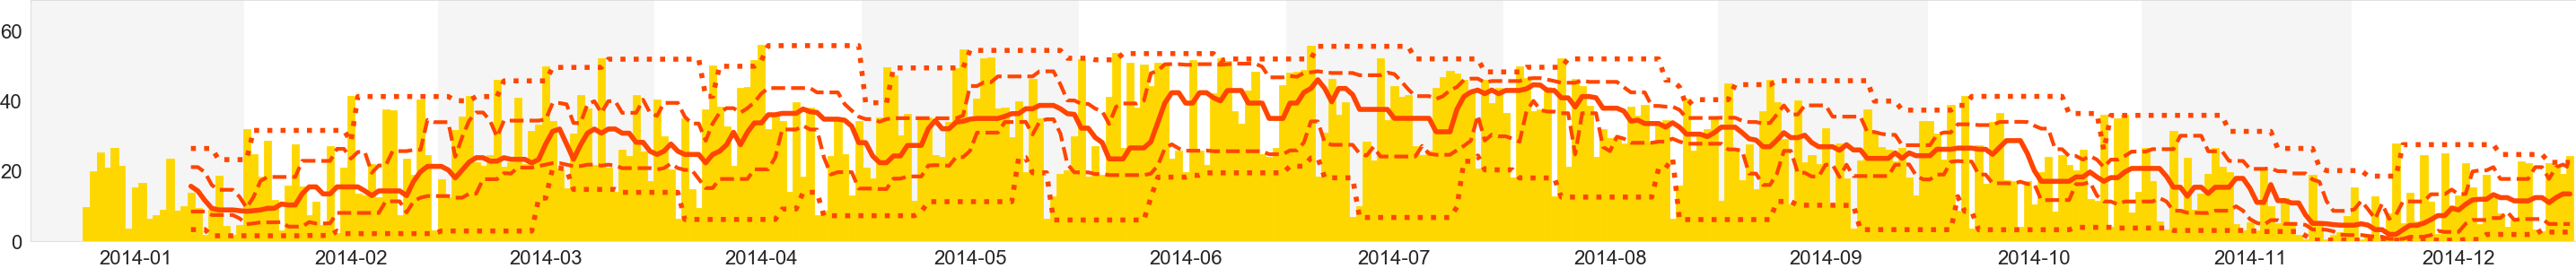
Our daily power generation in kWh (bars), along with minimum (dot-dashed), lower quartile (dashed), median (solid), upper quartile (dashed), maximum (dot-dashed) running averages over the previous 14 day sliding window.
On 29 April 2016 a quarter of the panels stopped generating. On 7 May 2016, a further quarter of the panels were taken offline for a short while around 11am, to help diagnose the fault. On 16 May the whole array was switched off for a short while, while panels were diagnosed and reconfigured; it was switched back on with all but one panel working. On 2 June 2016 the failed panel was replaced.

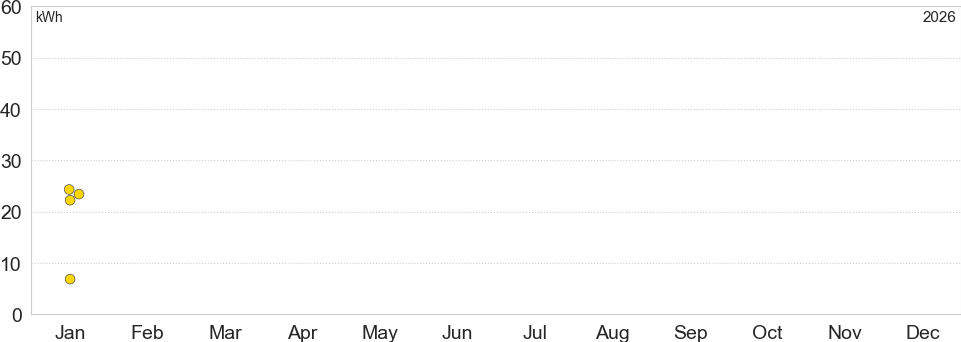
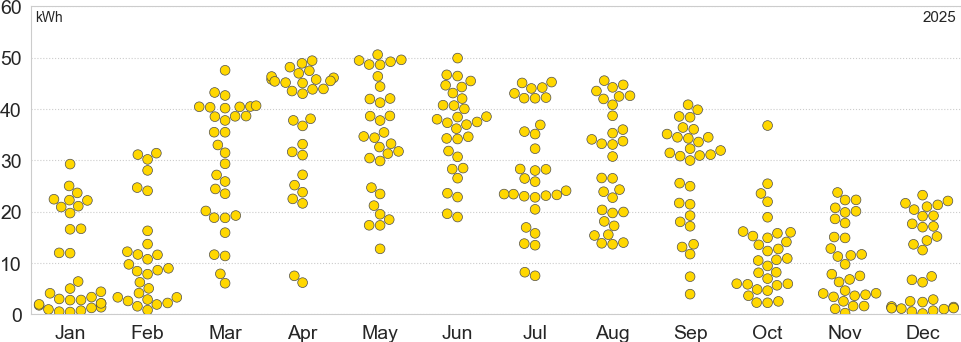
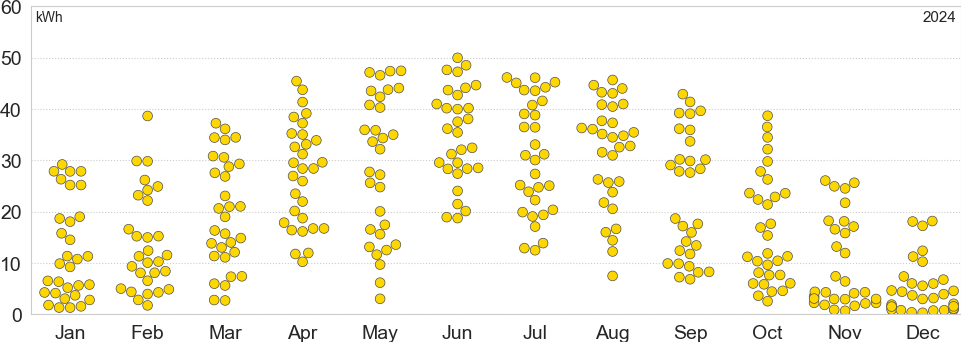
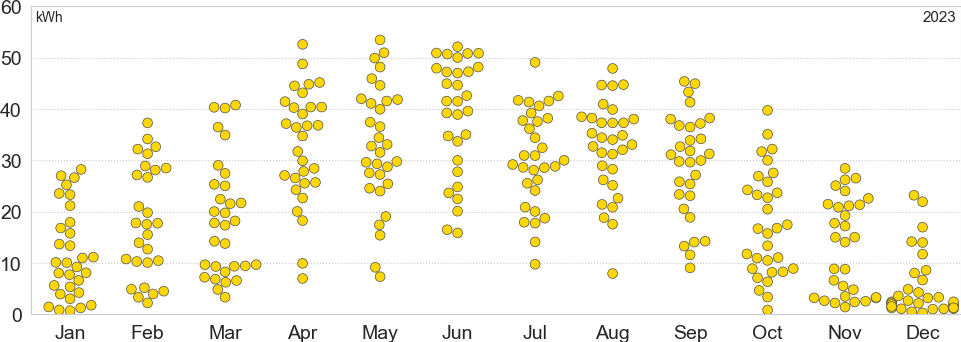
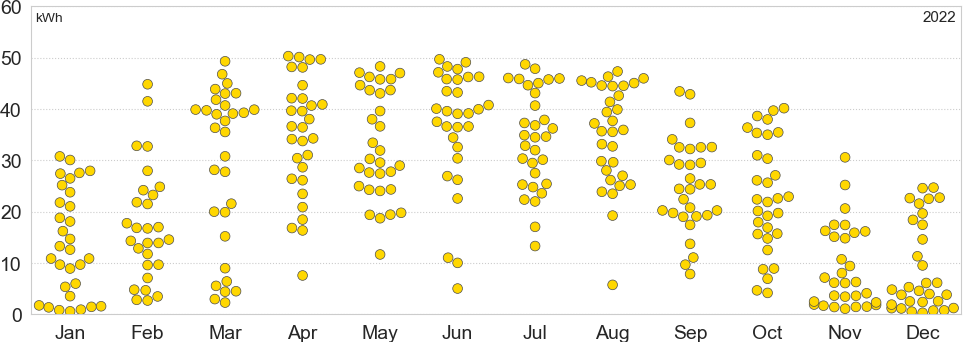
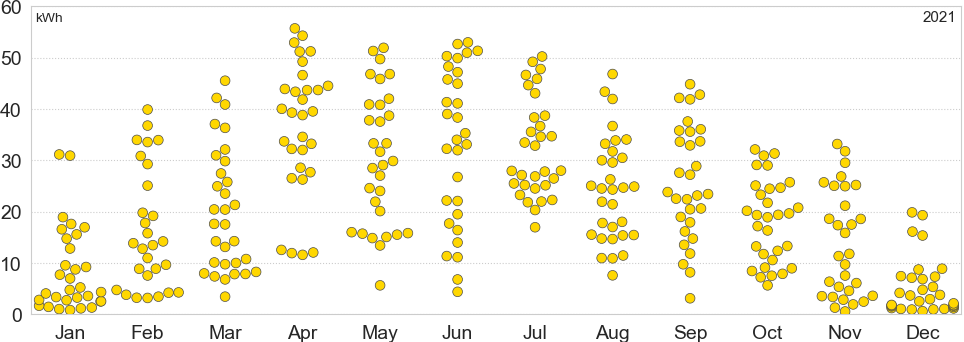
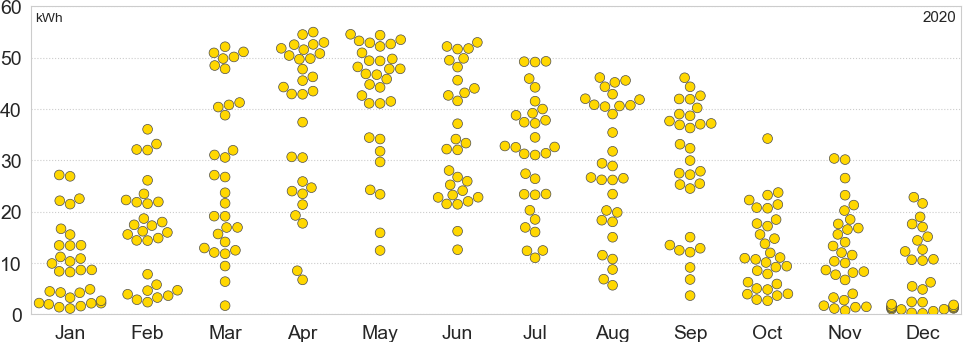
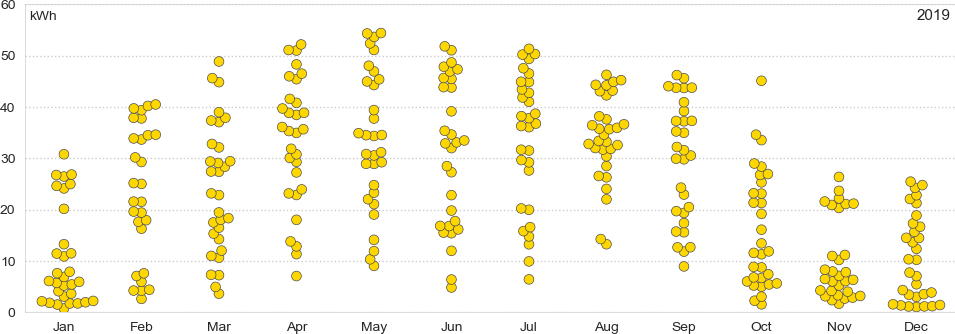
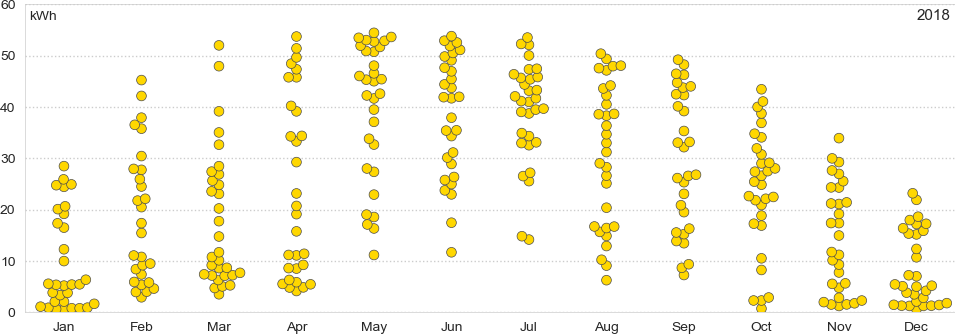
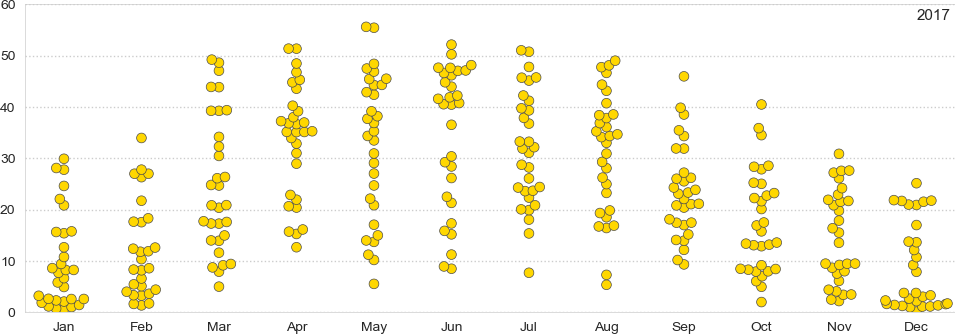
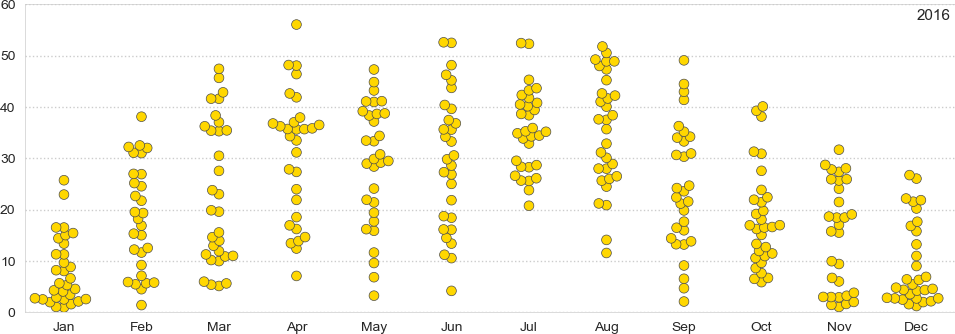
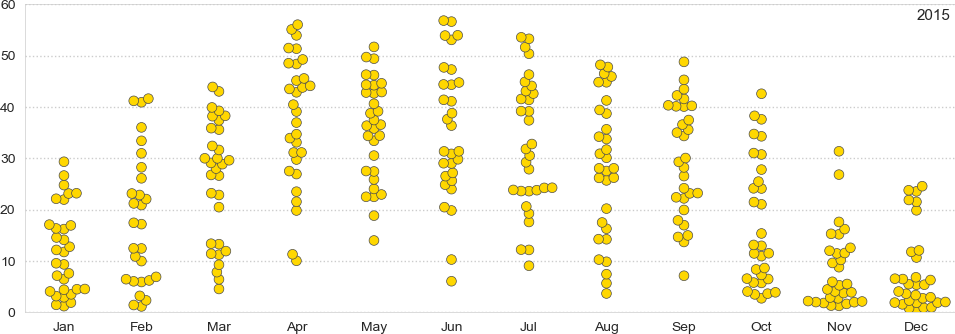
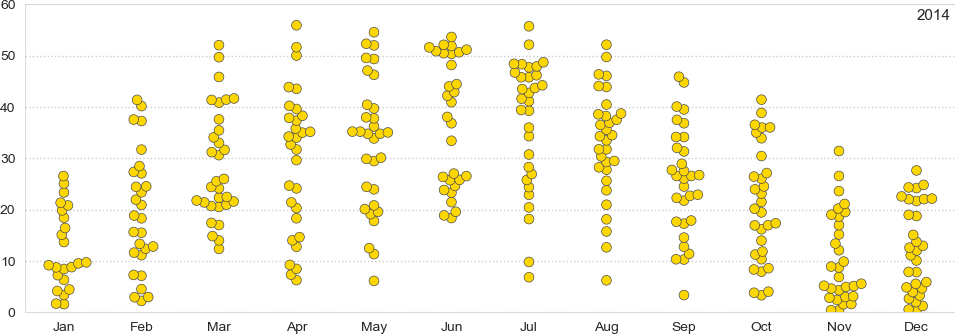
Our daily power generation in kWh, per month, using a jitter plot (some jitter is applied to the horizontal position, to prevent overlapping).
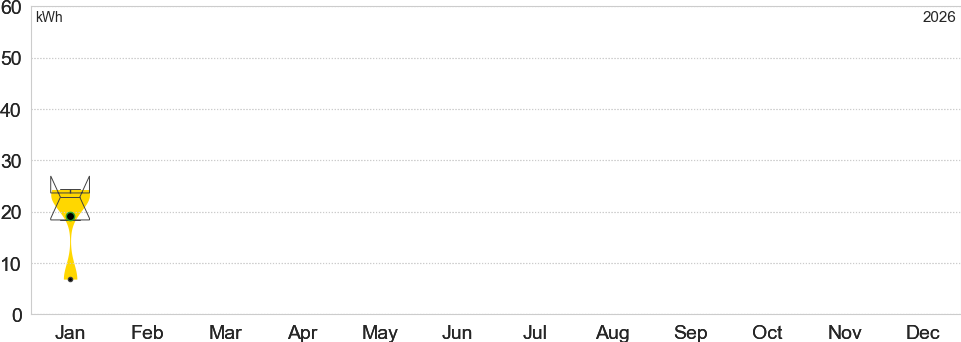
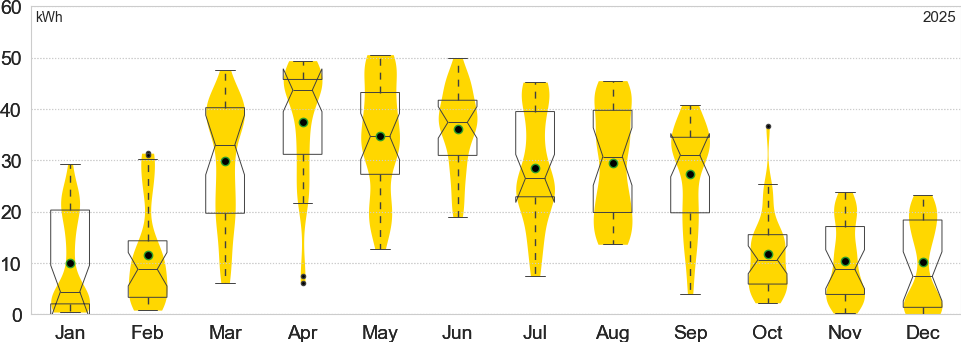
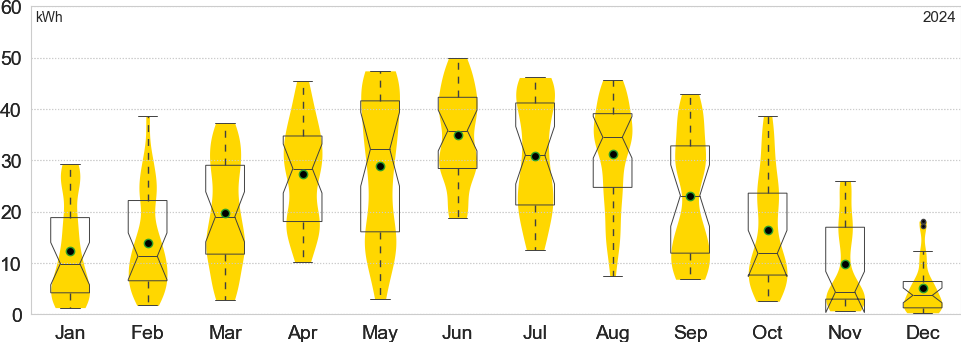
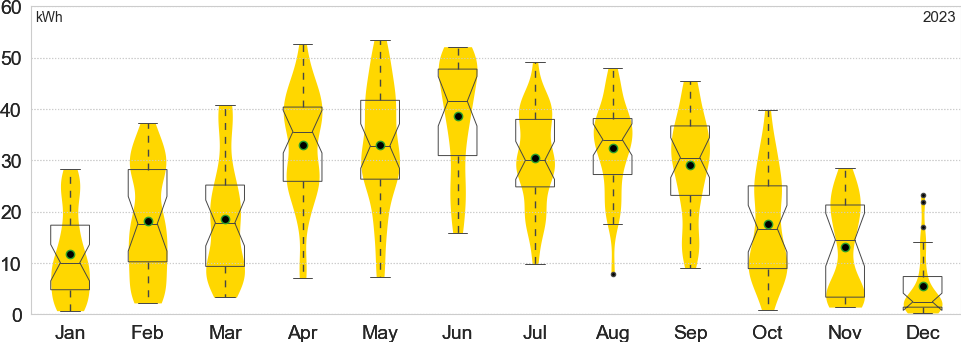
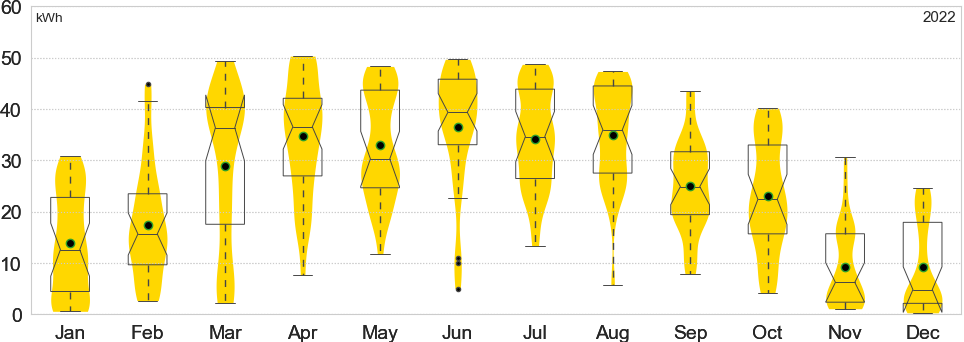
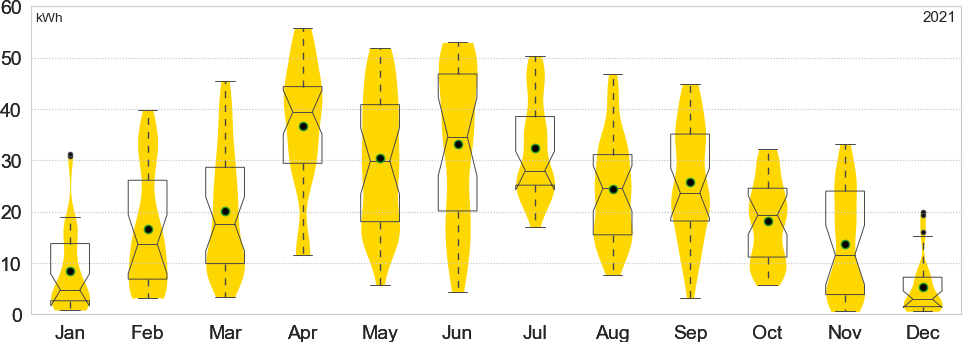
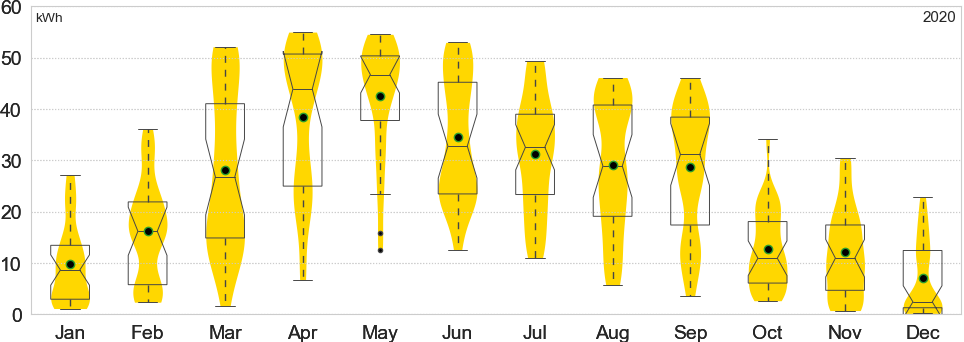
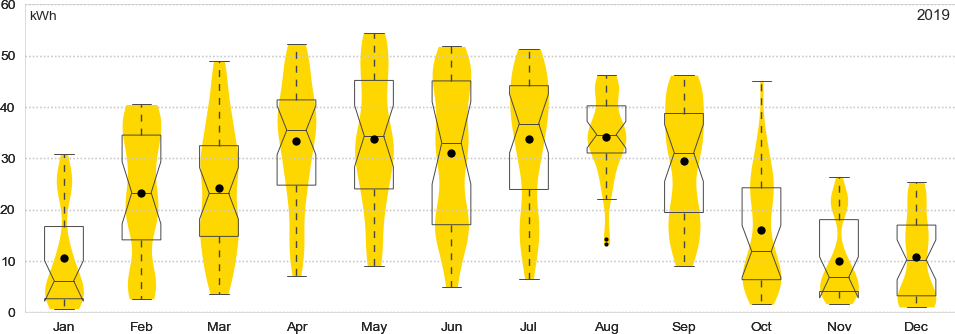
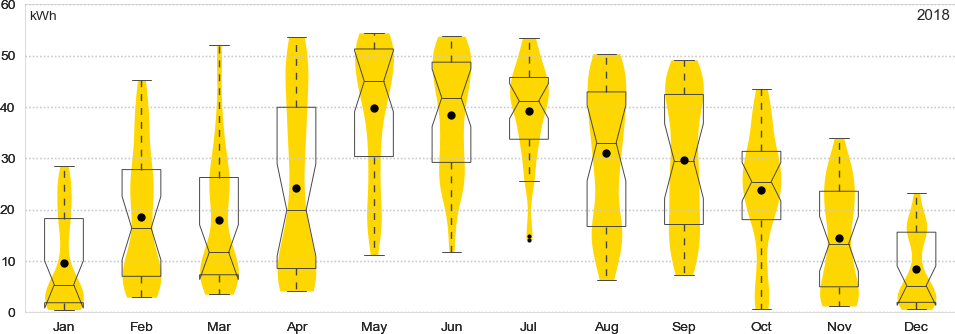
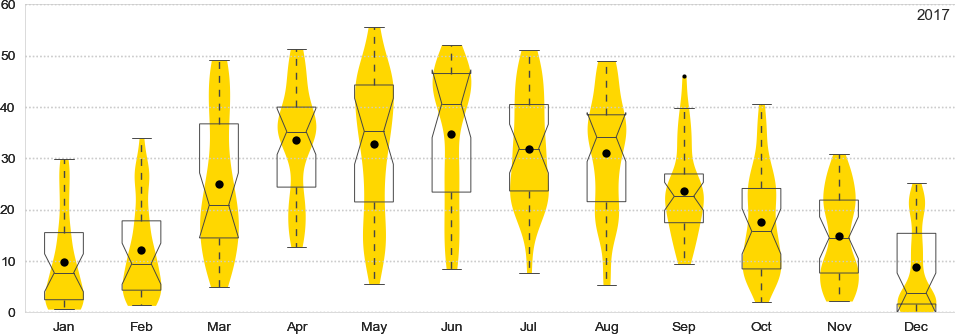
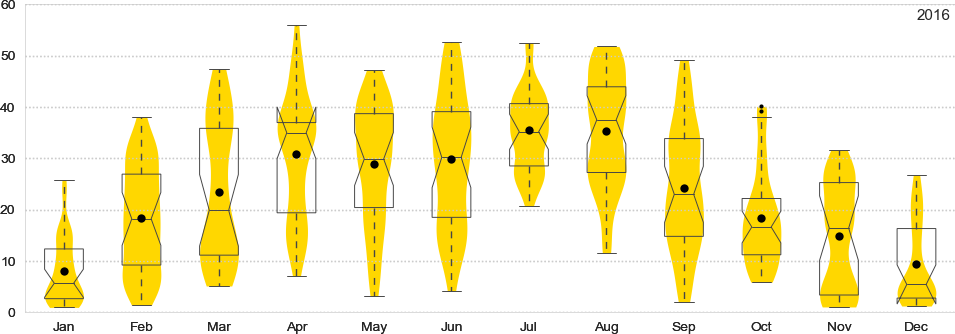
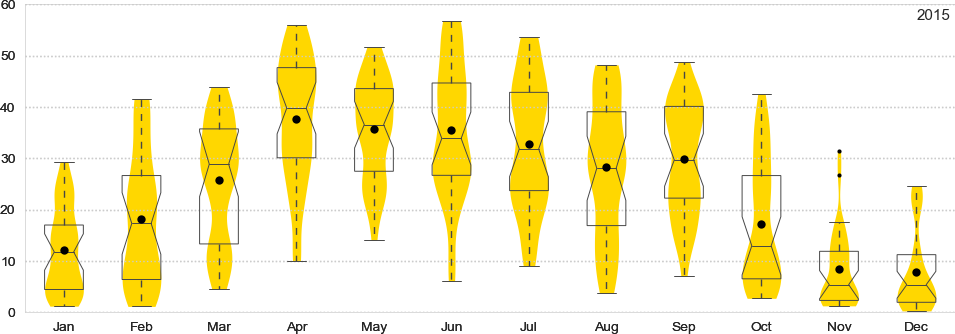
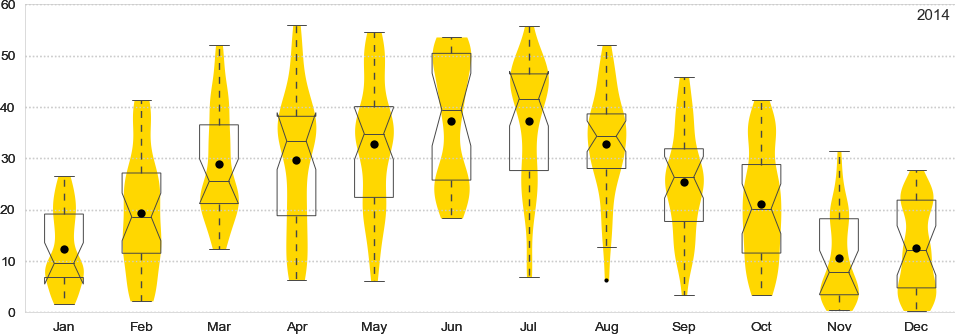
Our daily power generation in kWh, per month, using violin plots (a notched box and whisker plot—where the box shows the inter-quartile range, with 95% confidence interval notches; whiskers show data within 1.5*IQR—plus a kernel density plot). The final, partial, month tends to have larger notches, because it has less data.
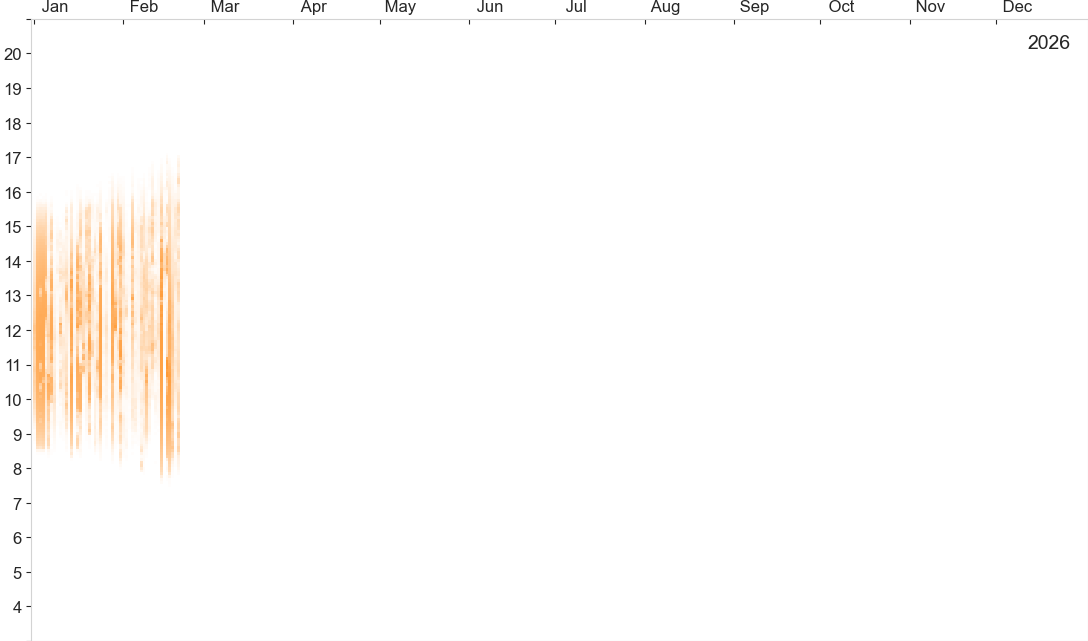
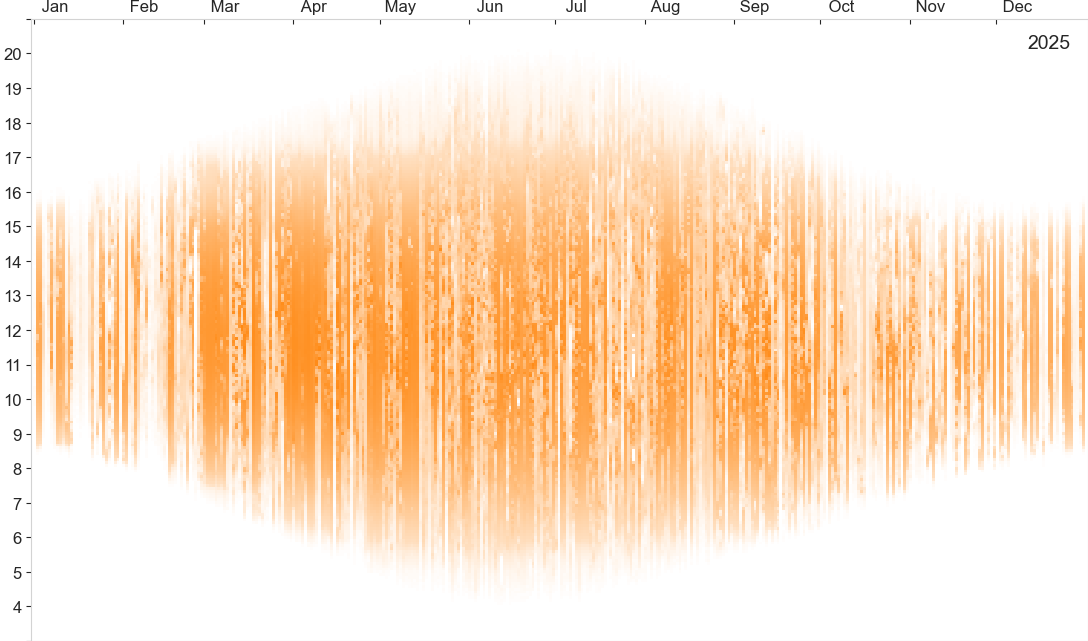
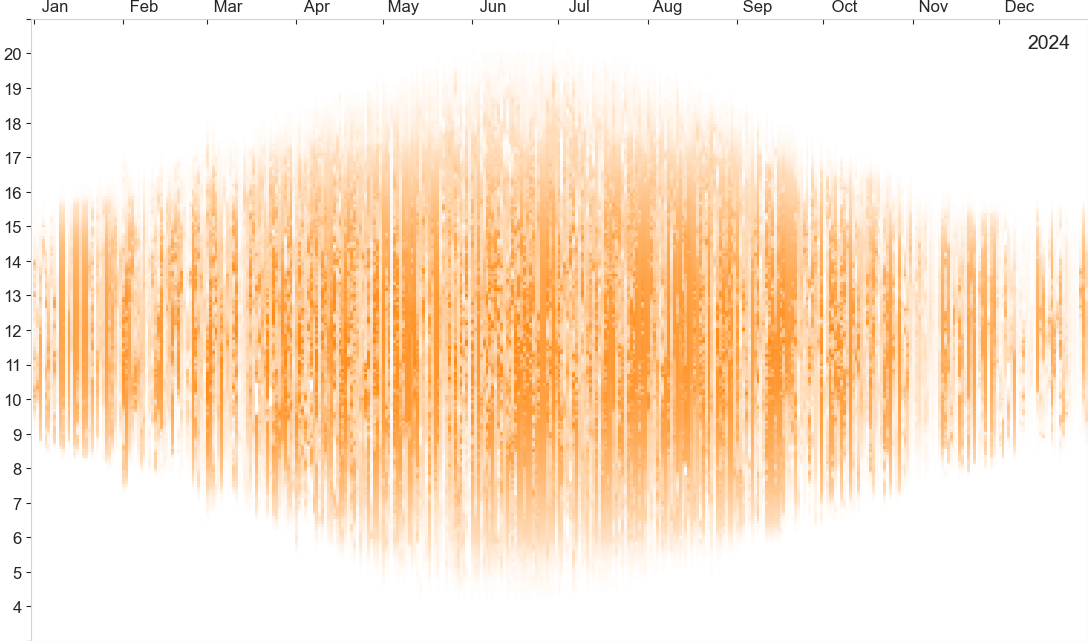
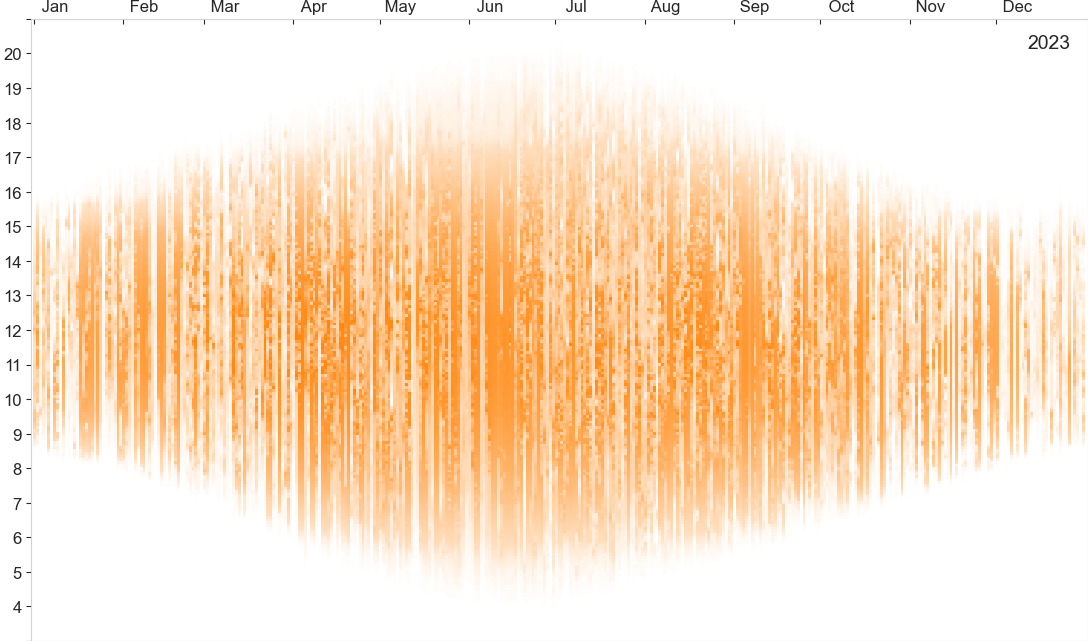
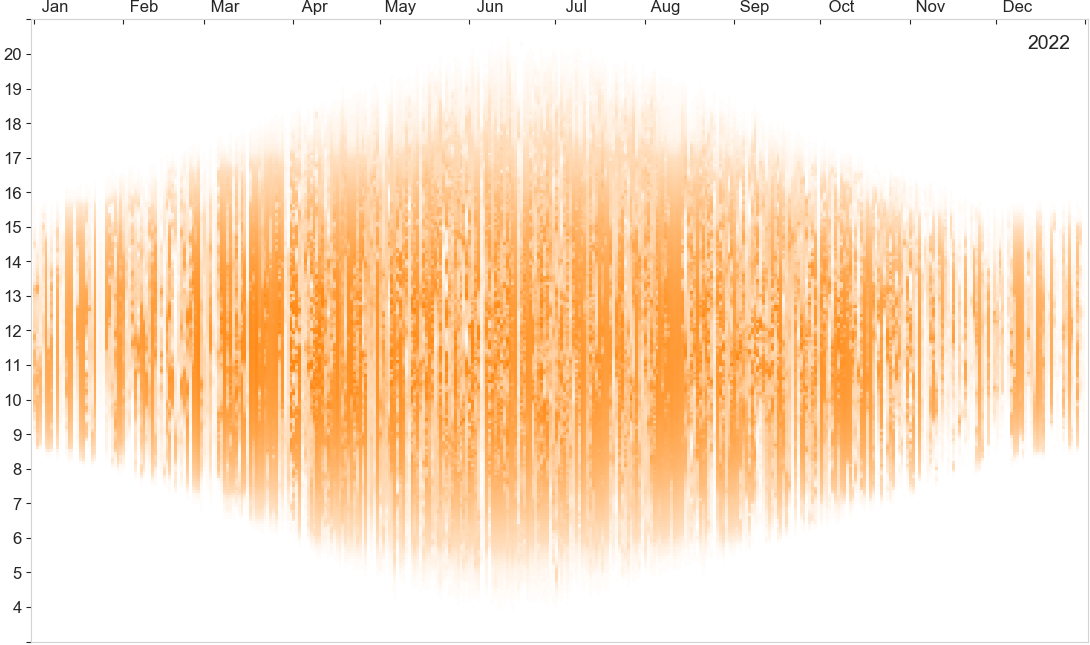
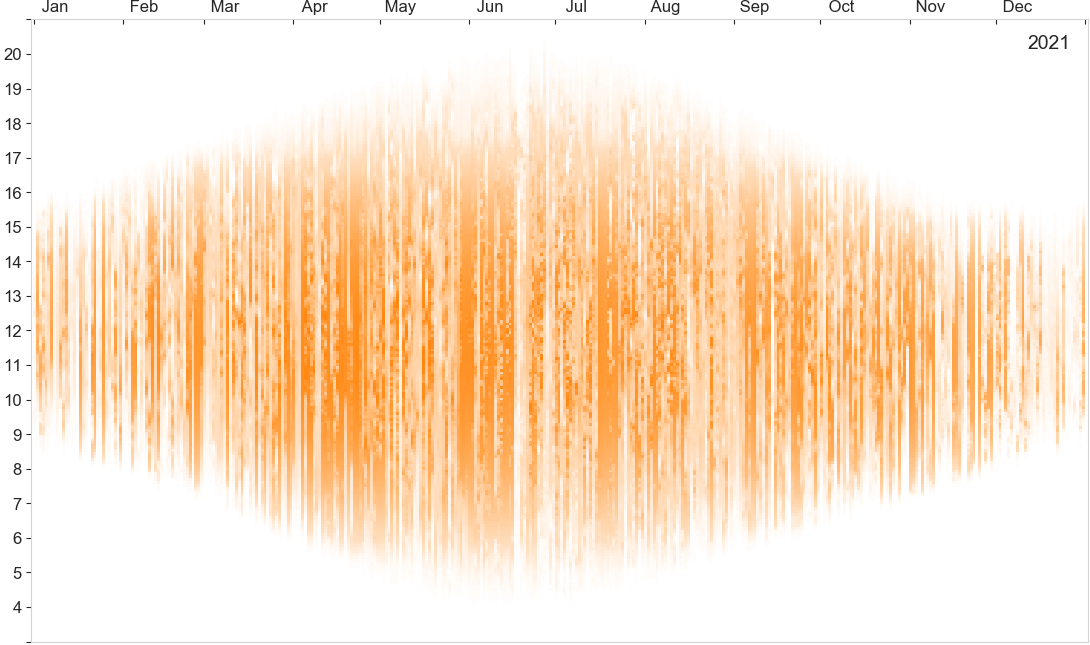
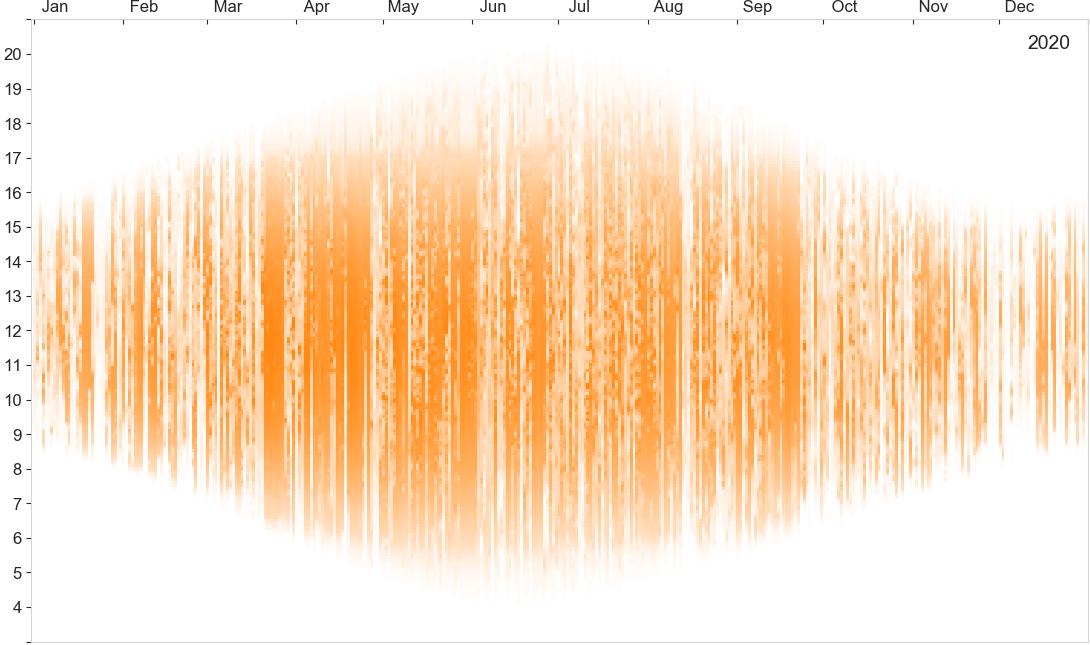
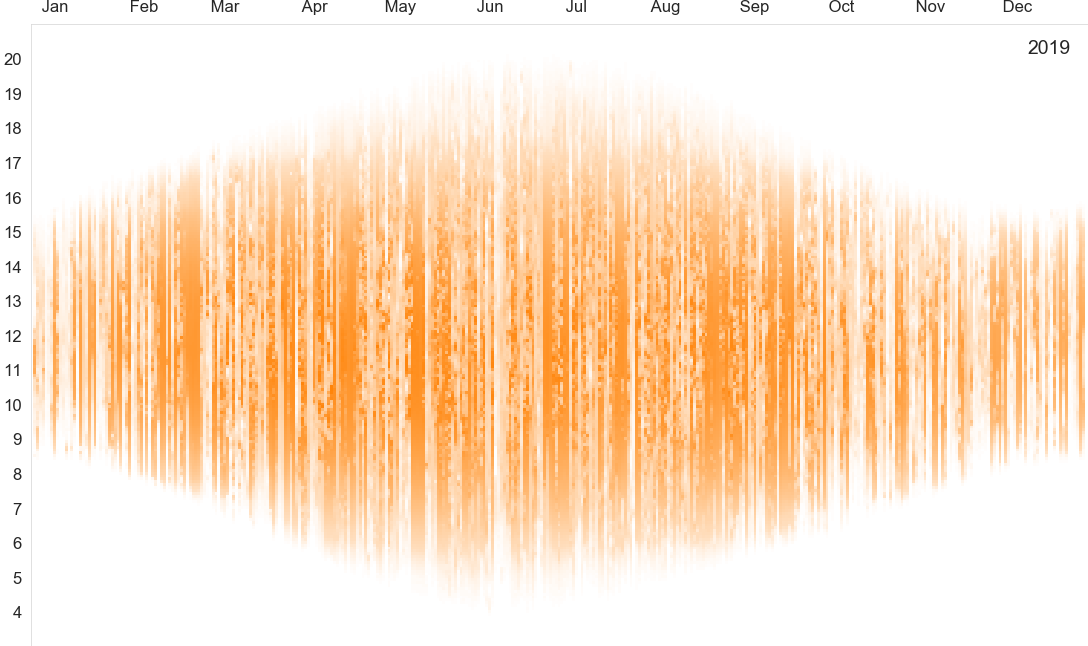
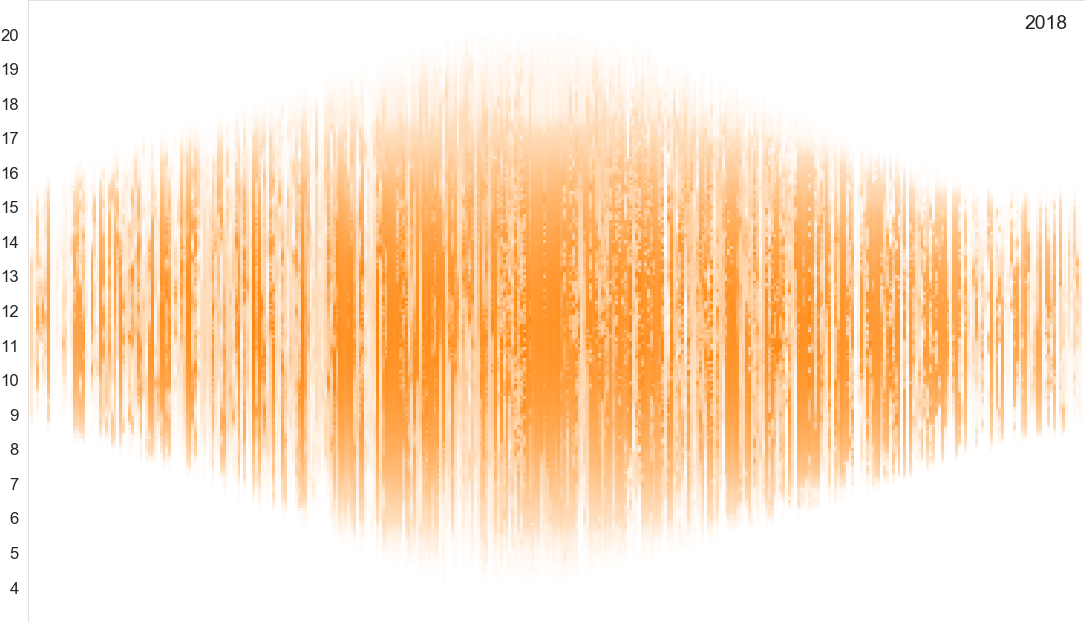
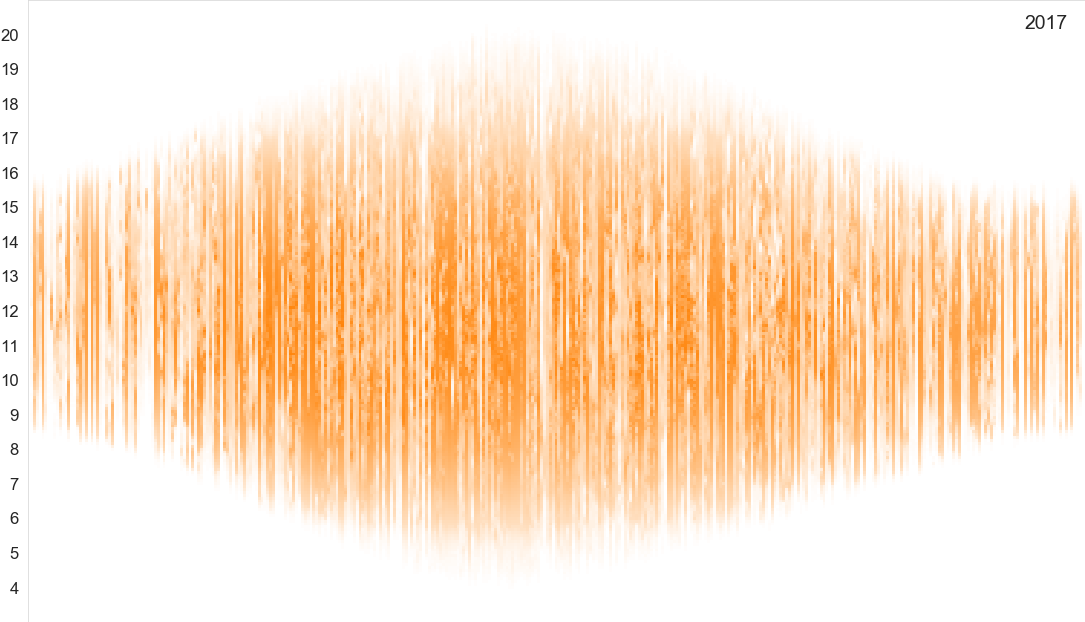
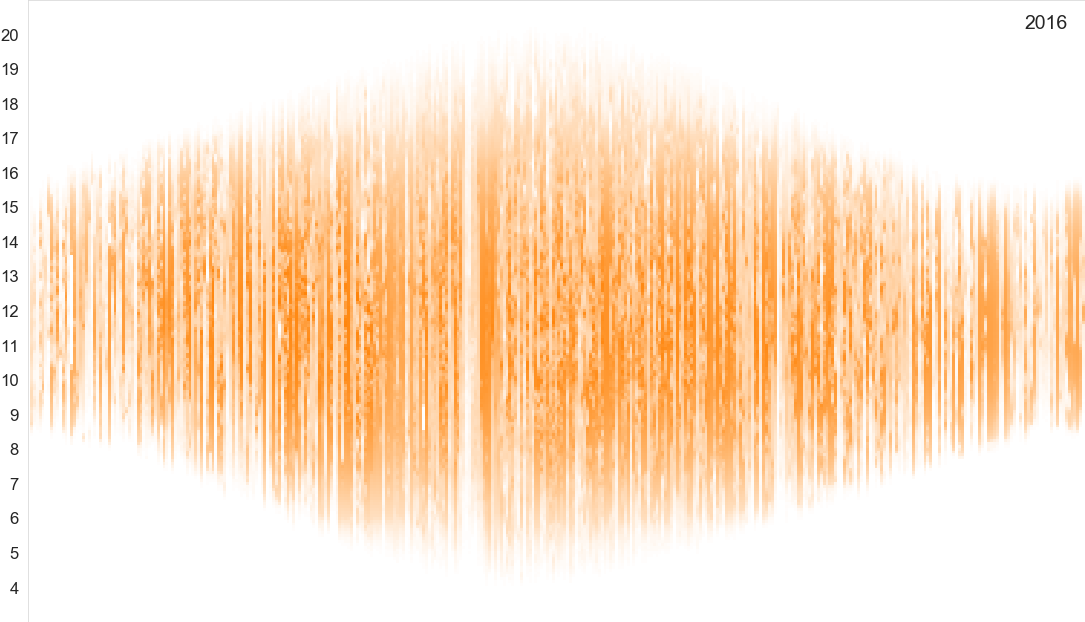
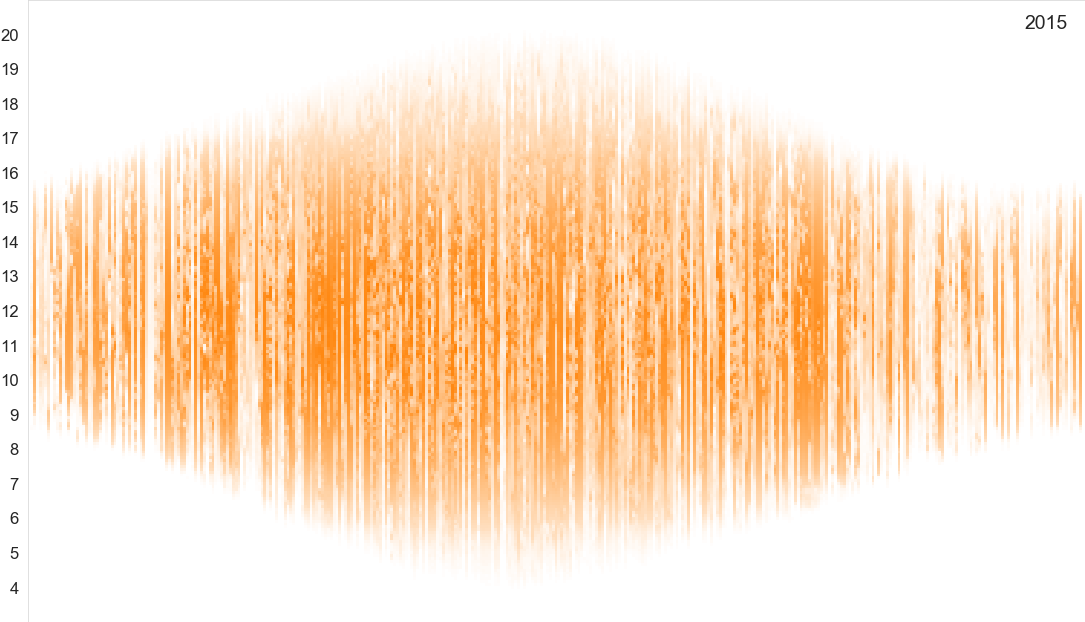
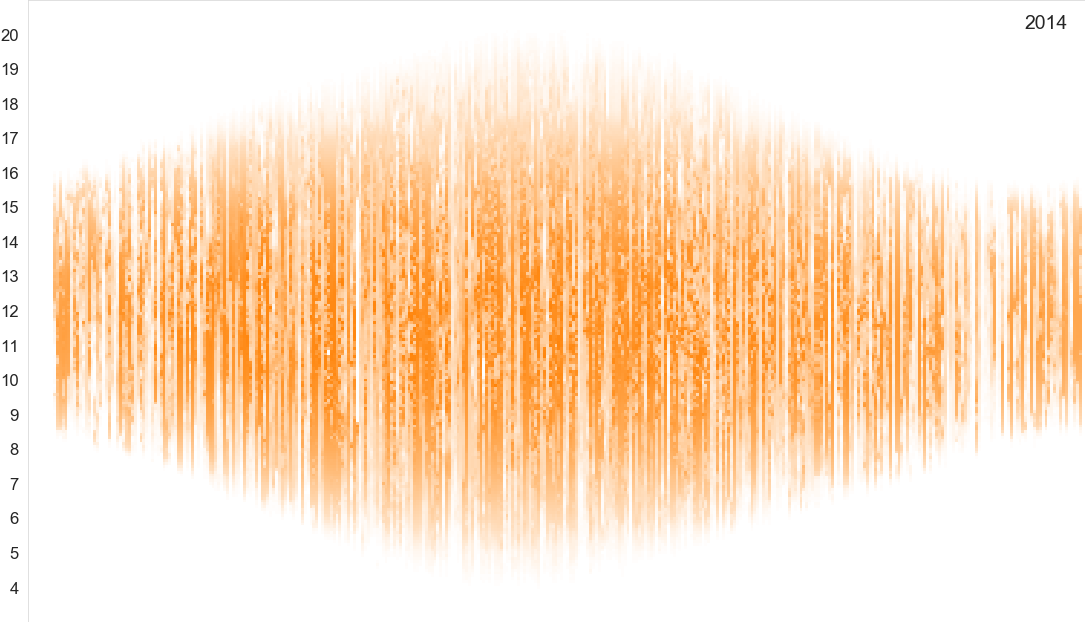
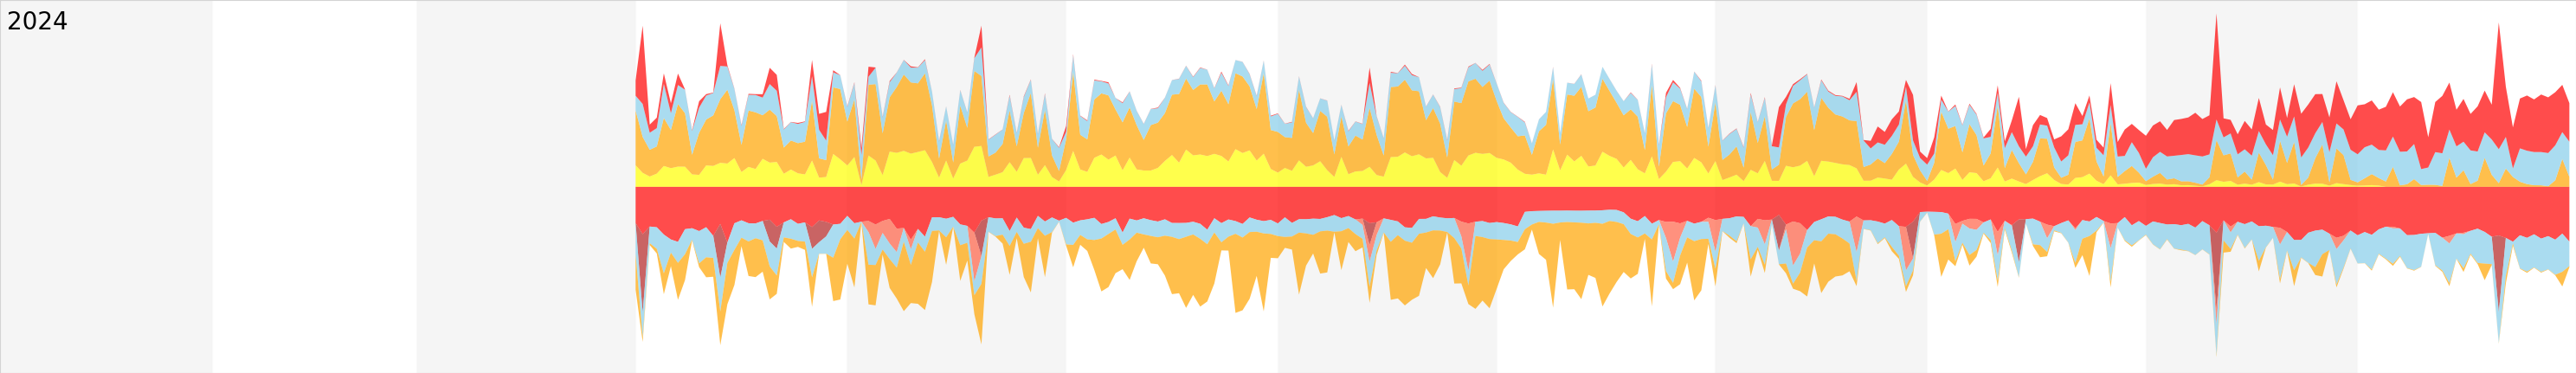
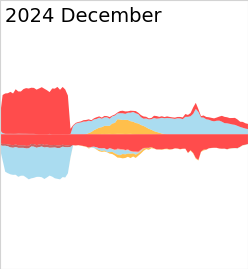
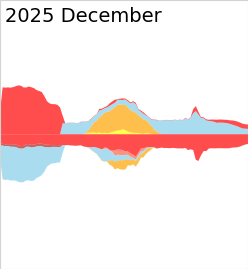
The vertical time axis runs from 3:00am to 9:00pm GMT. There is one column of data per day. Data is gathered every 5 minutes.
Each pixel represents the energy generation at the sample point. The colour indicates the energy generation in the relevant interval: darker colours indicate more energy.
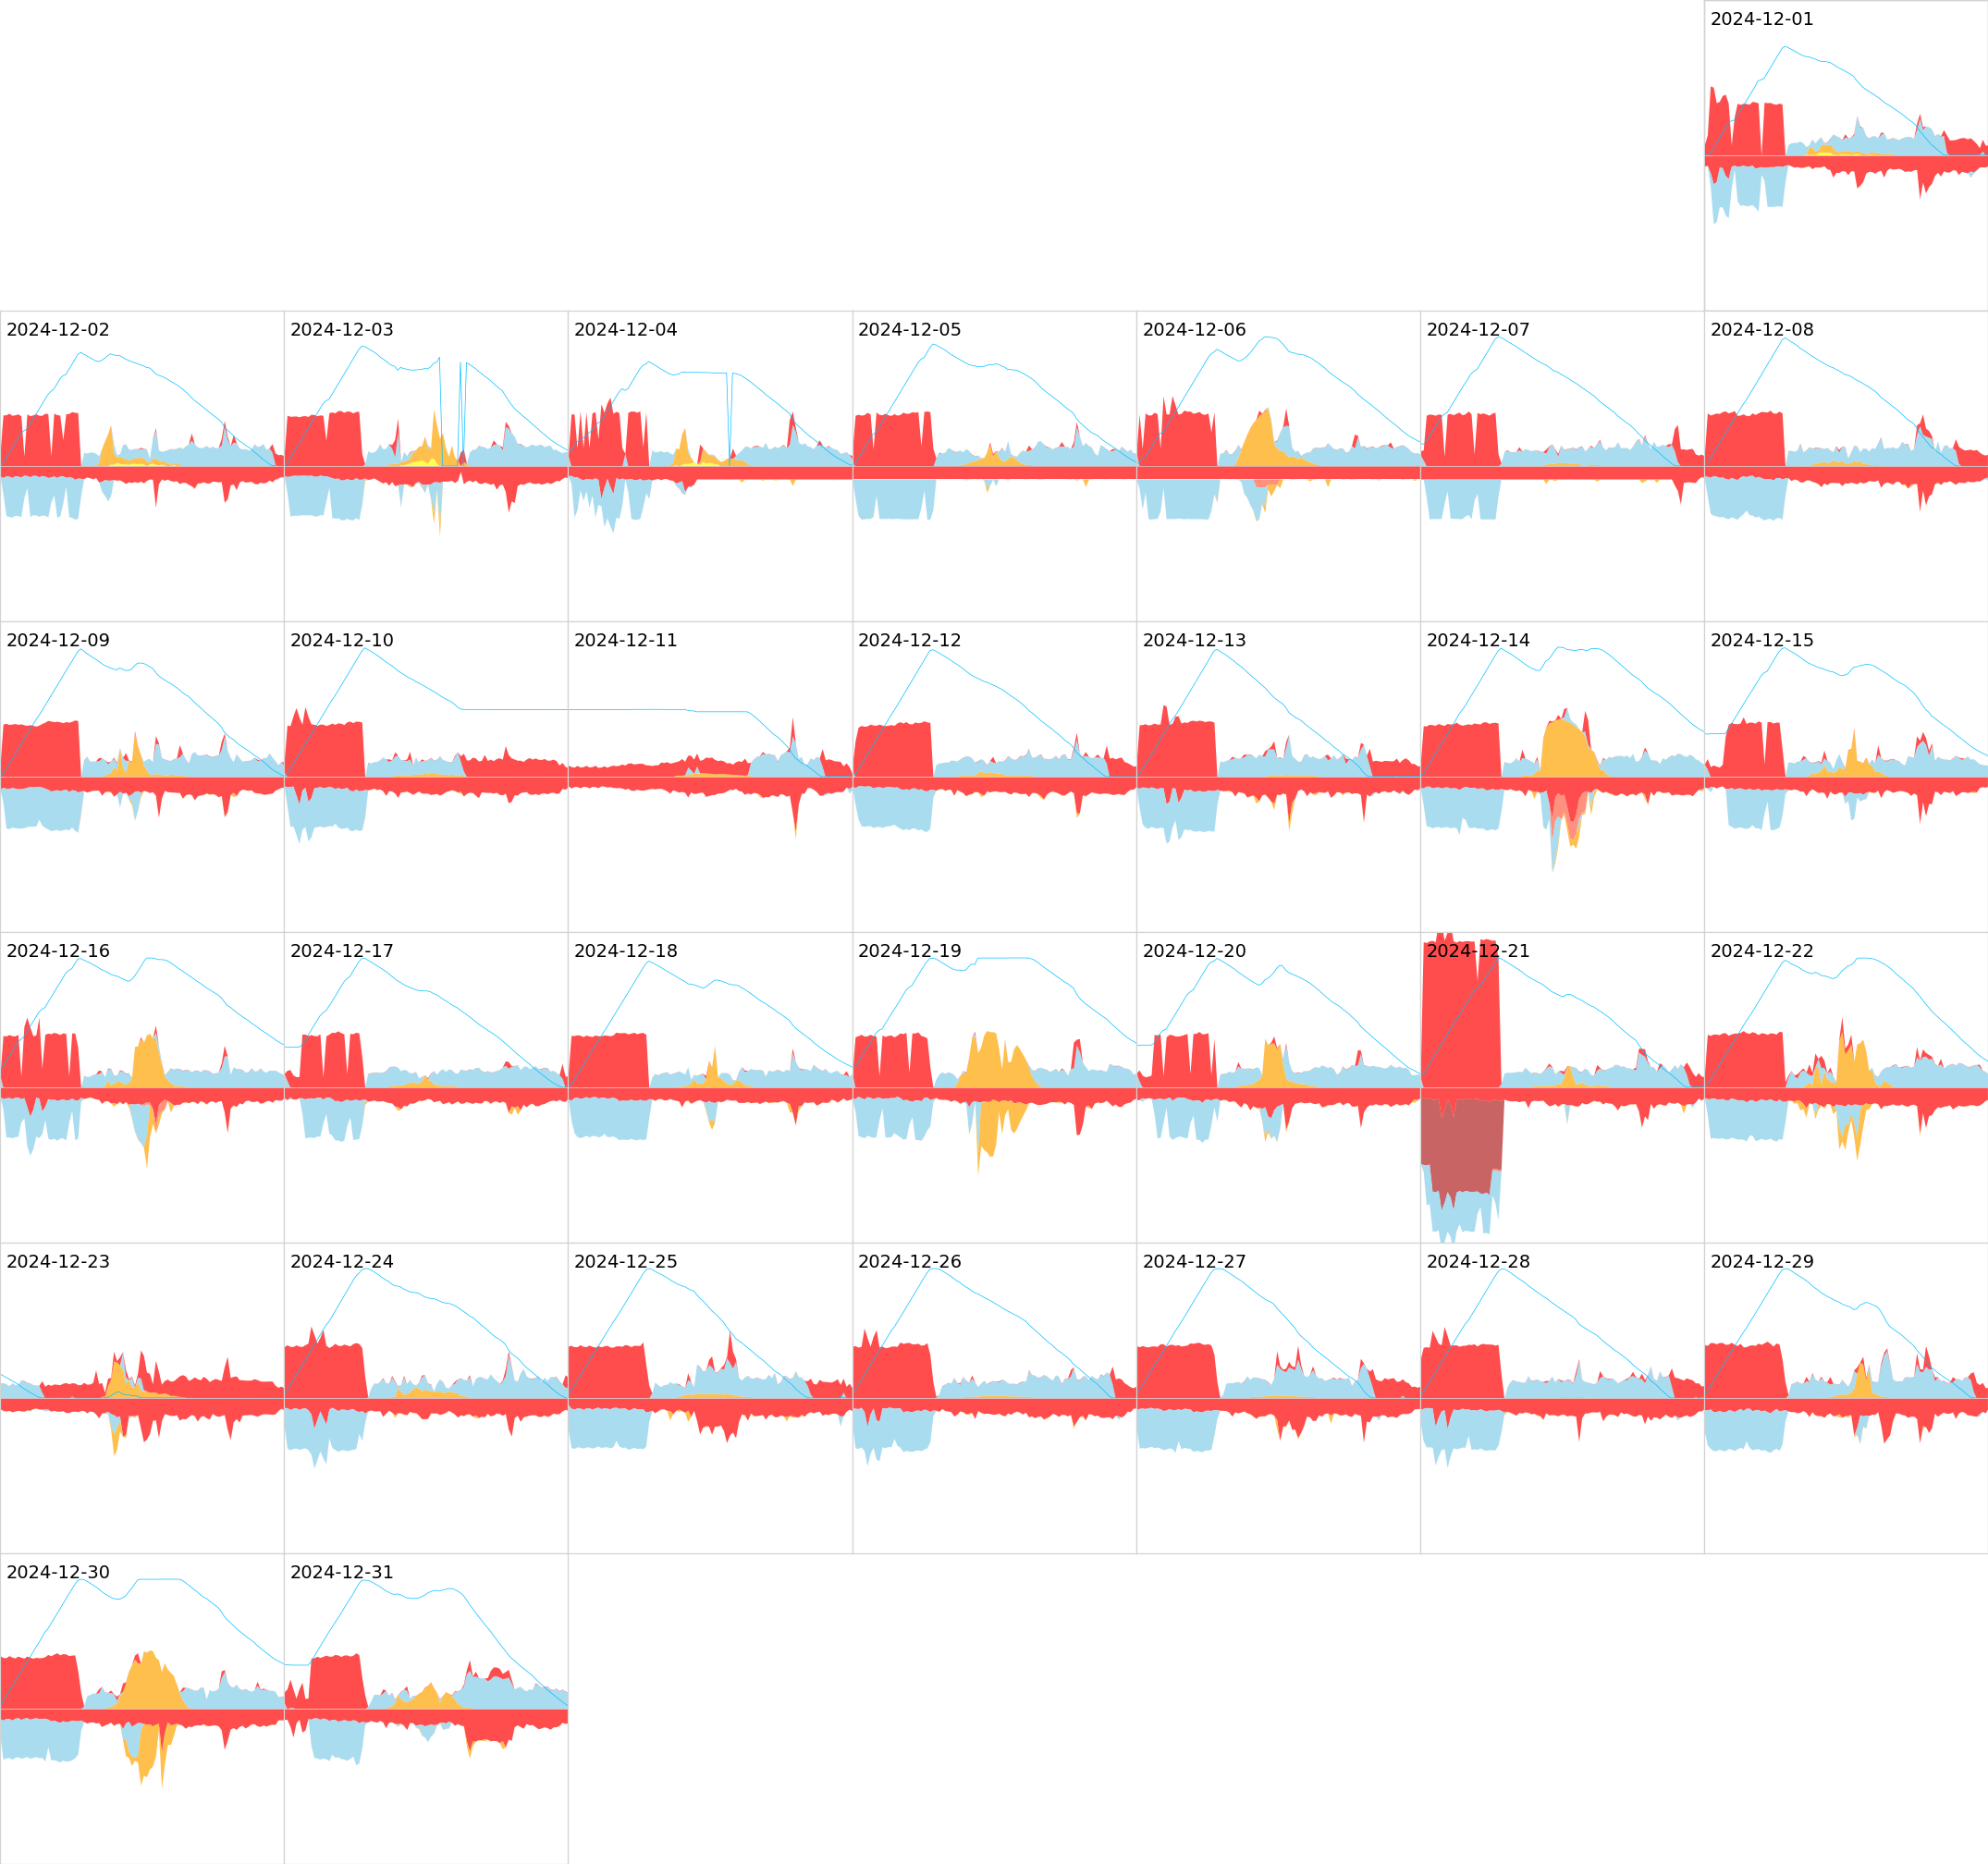
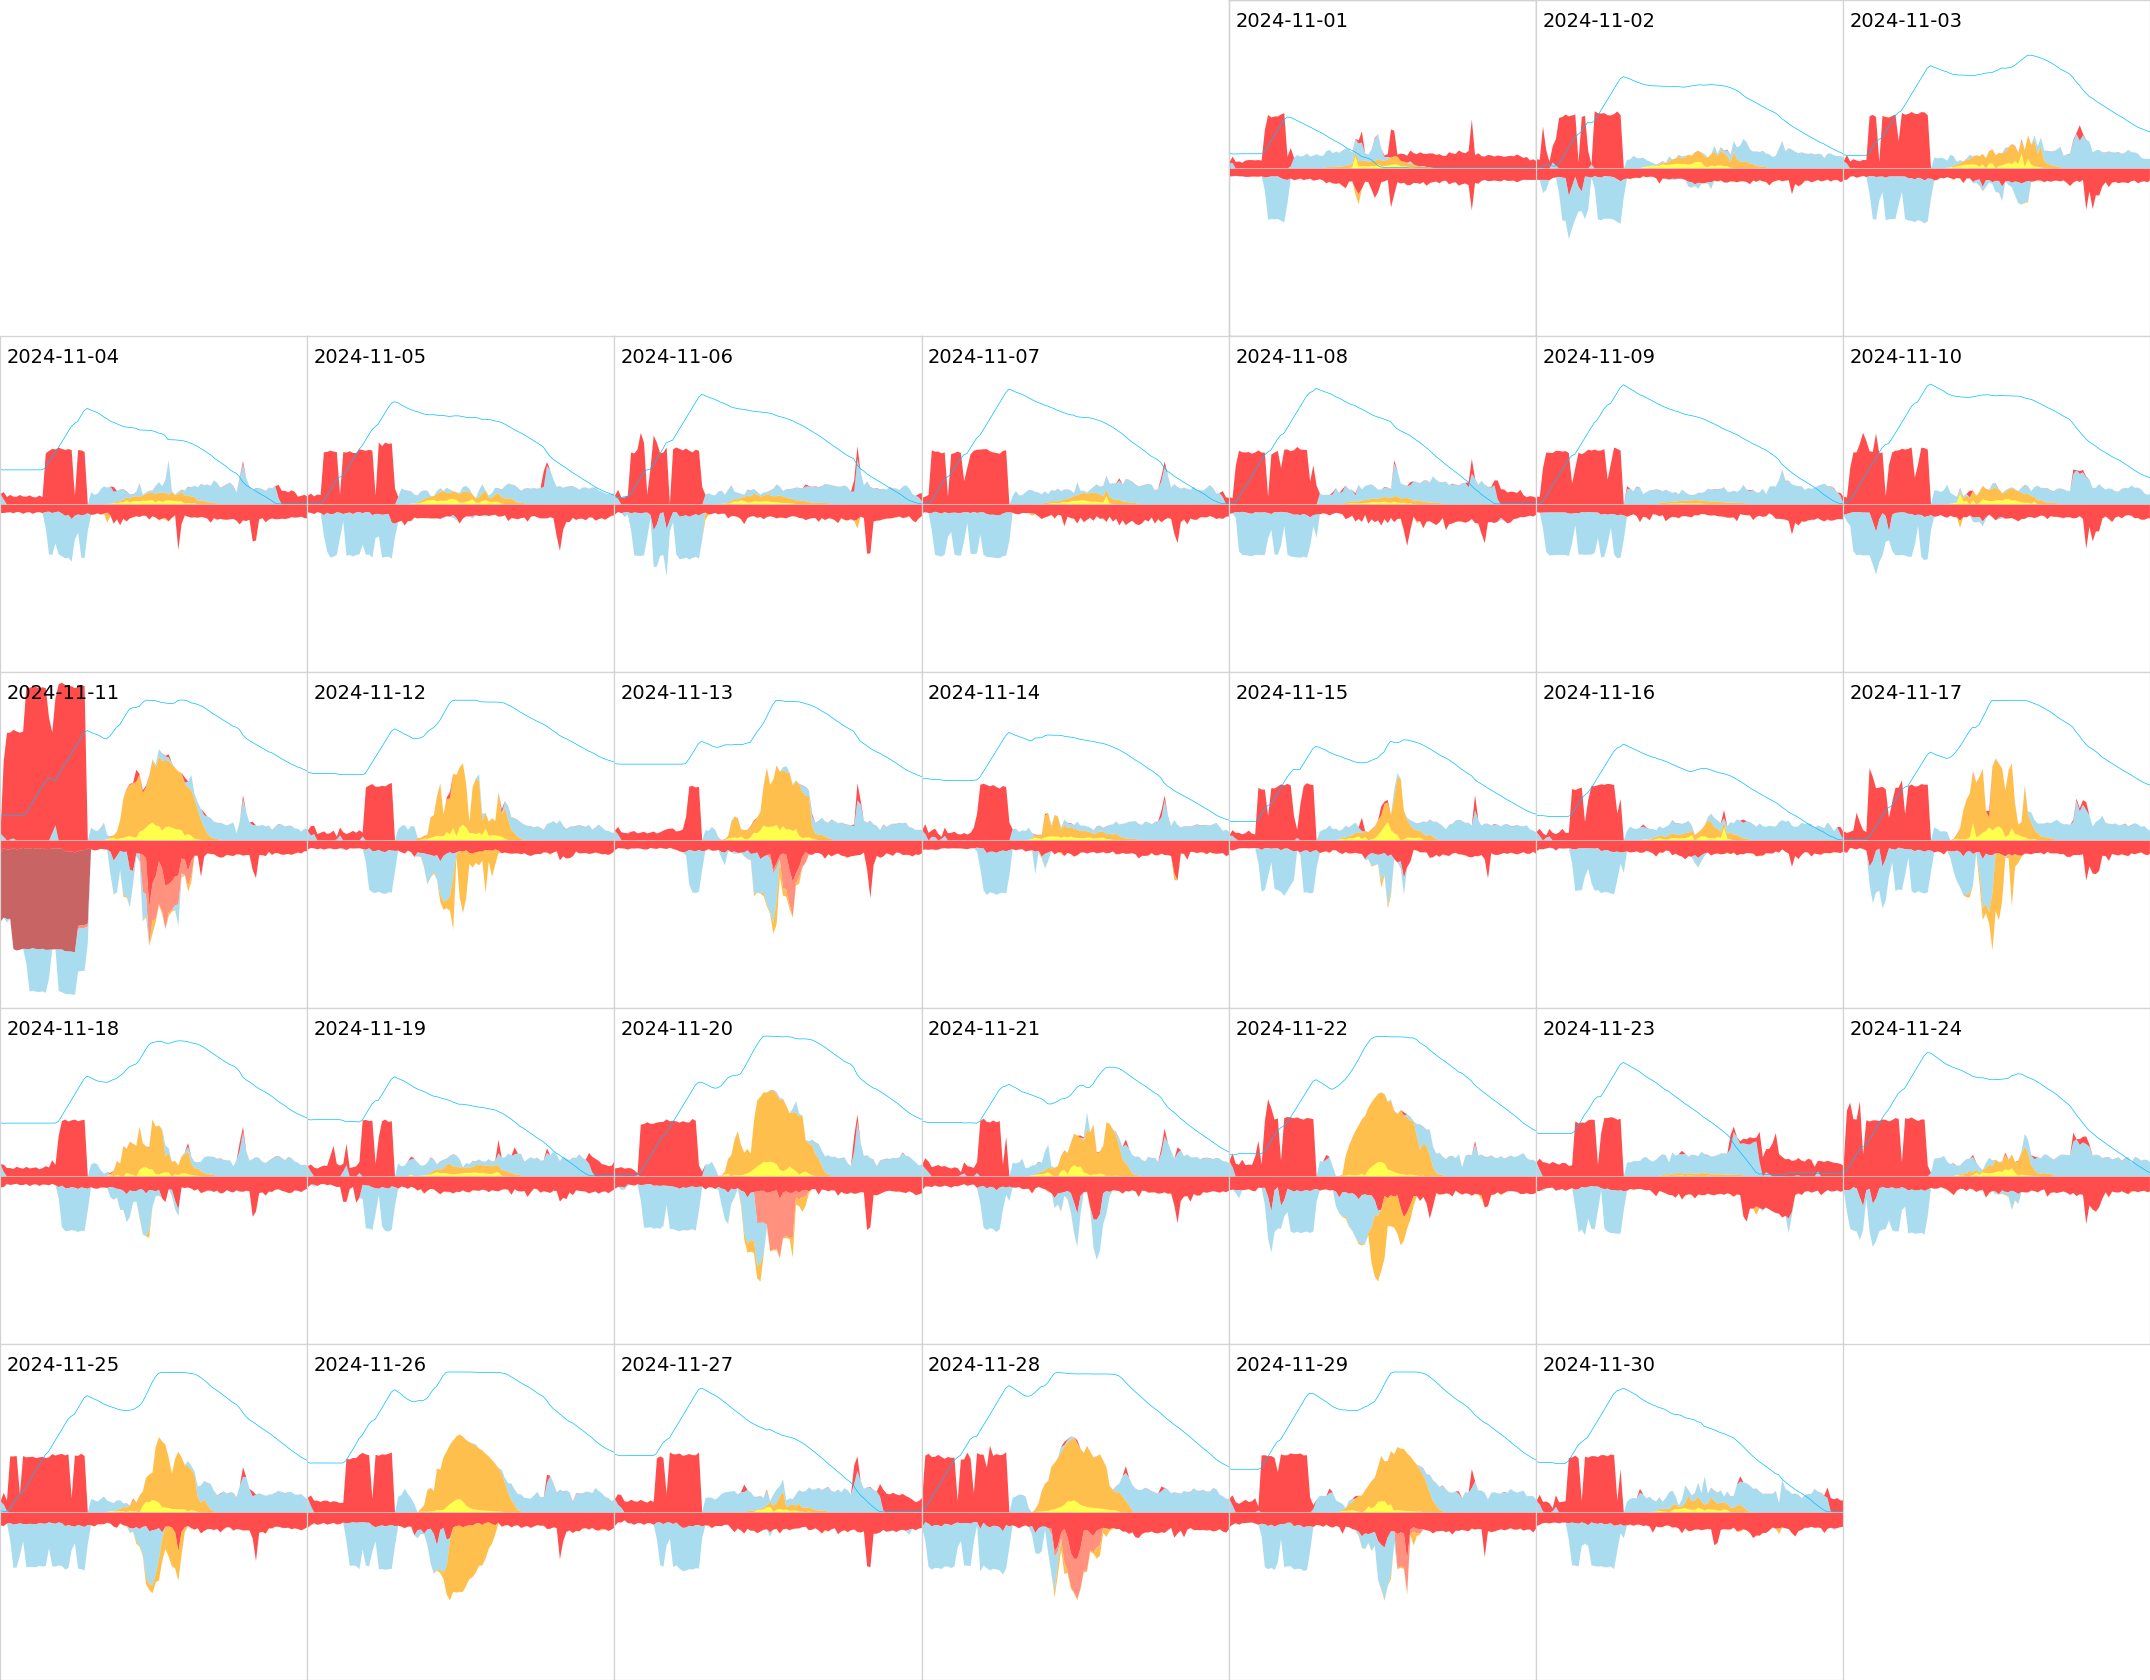
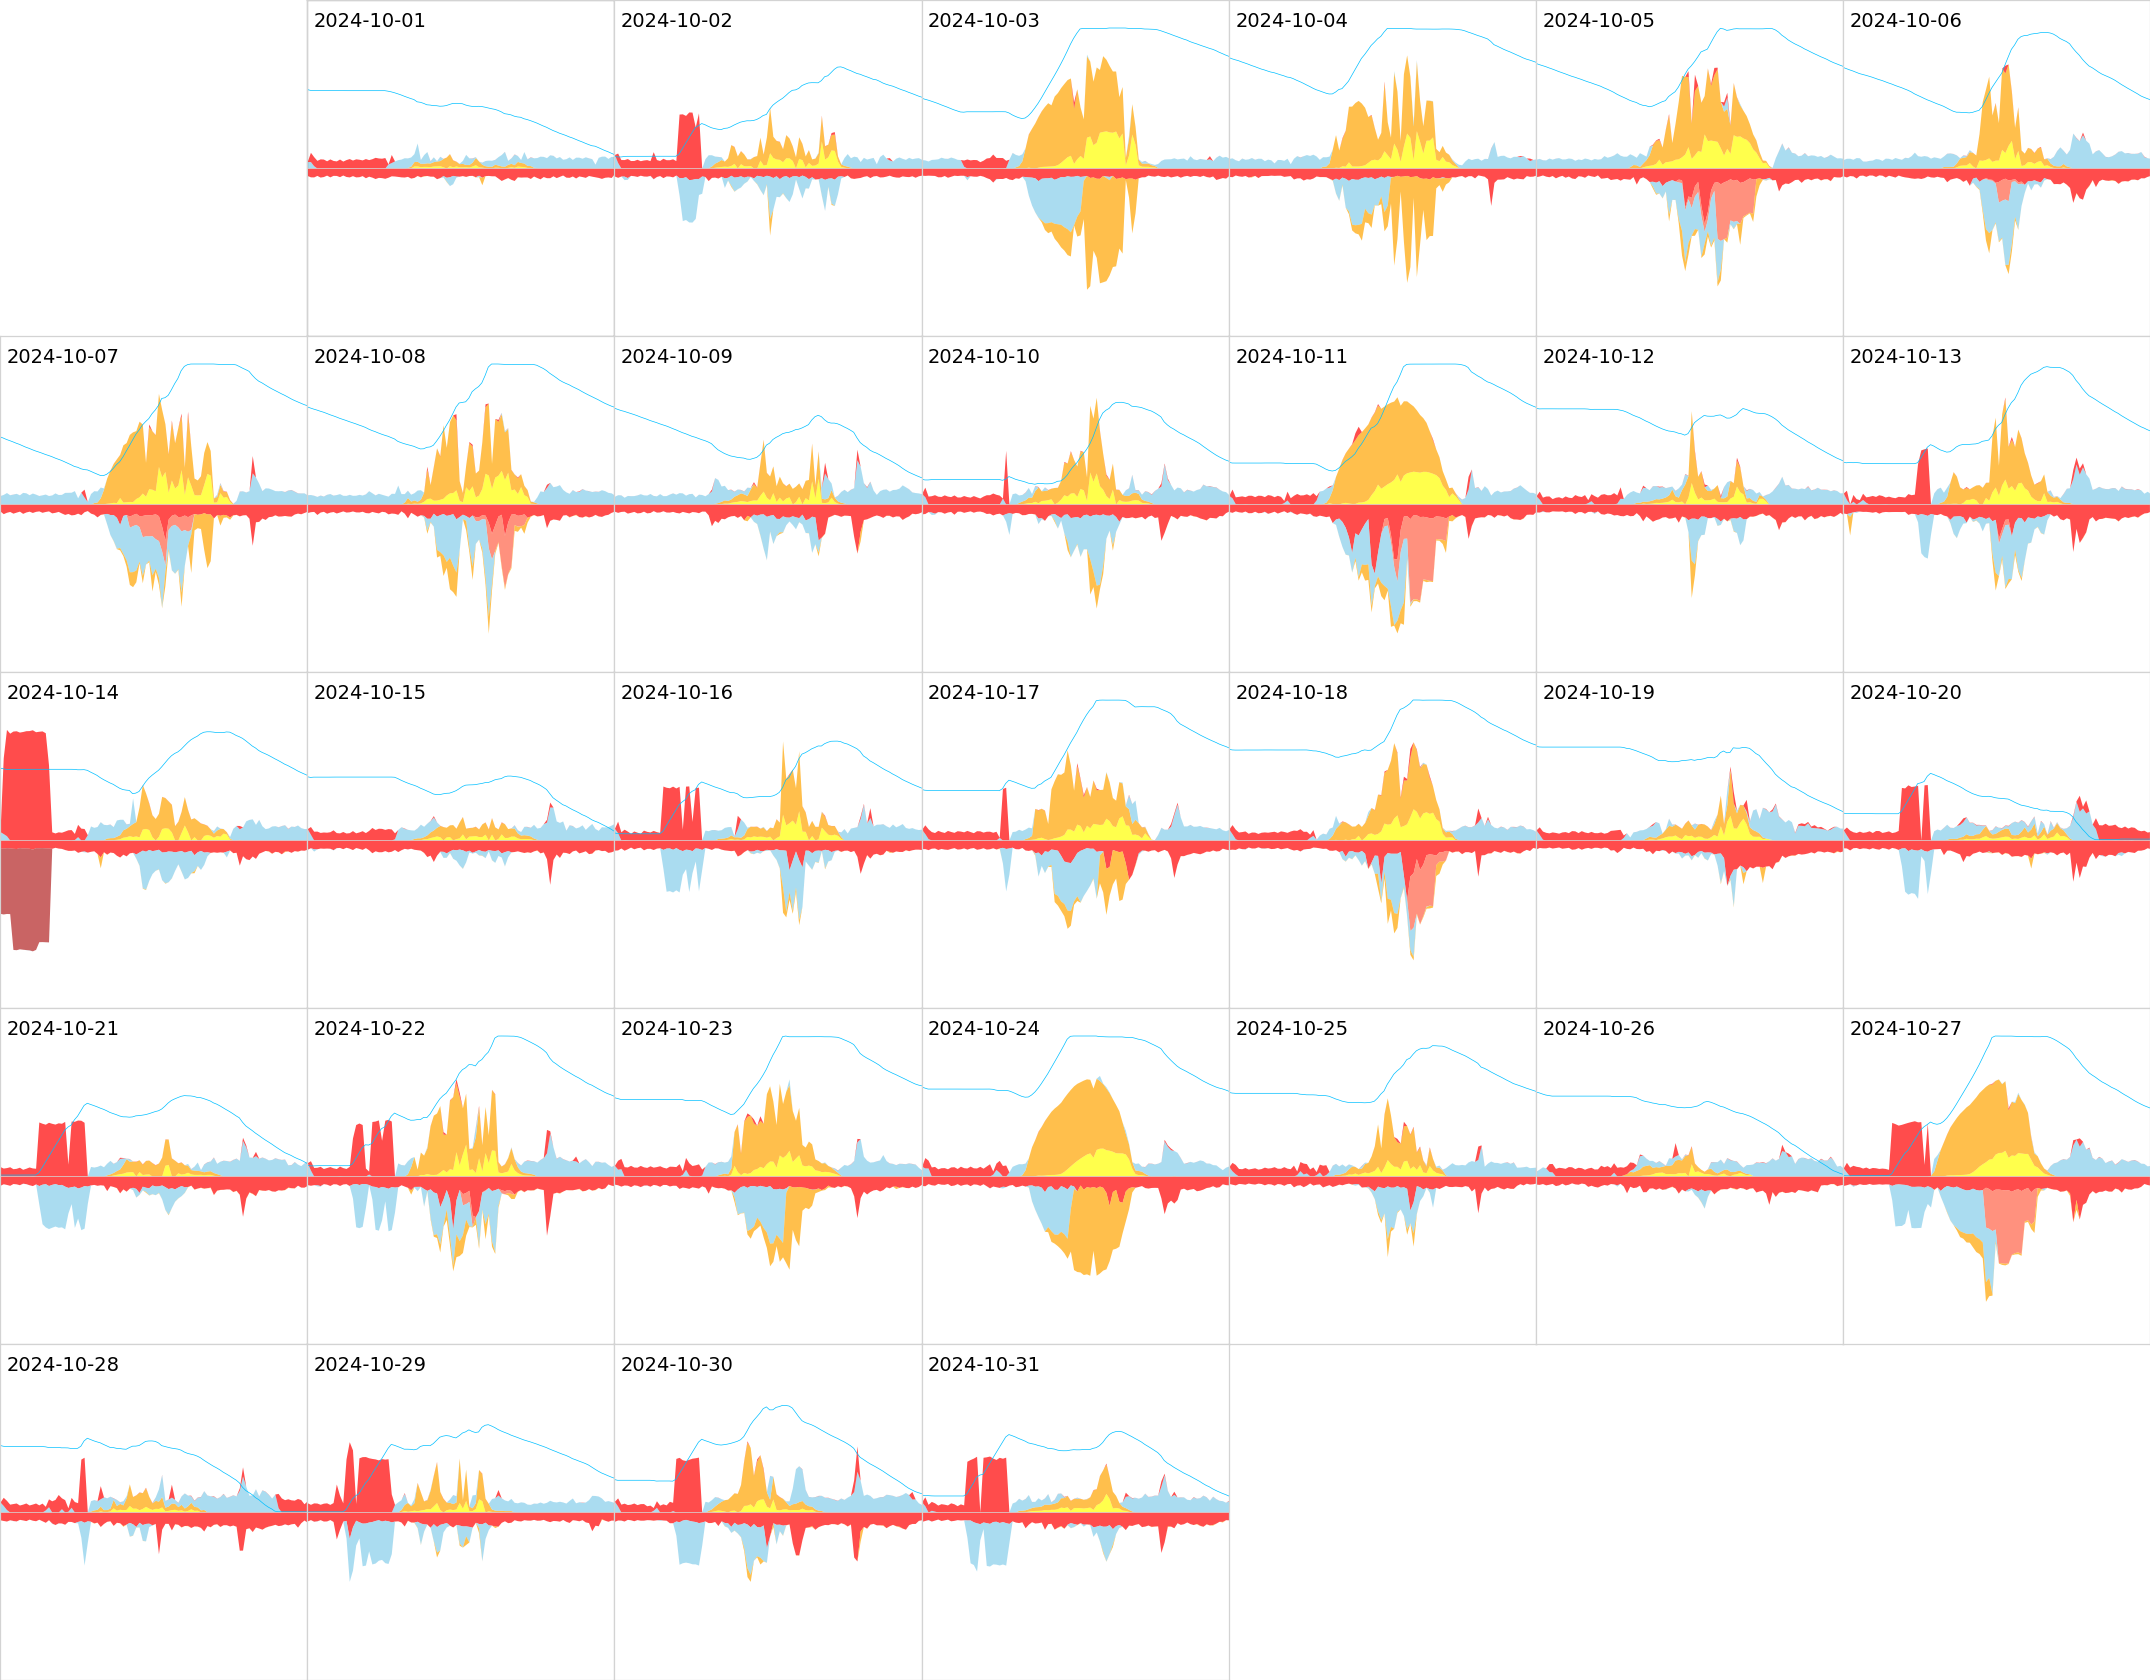
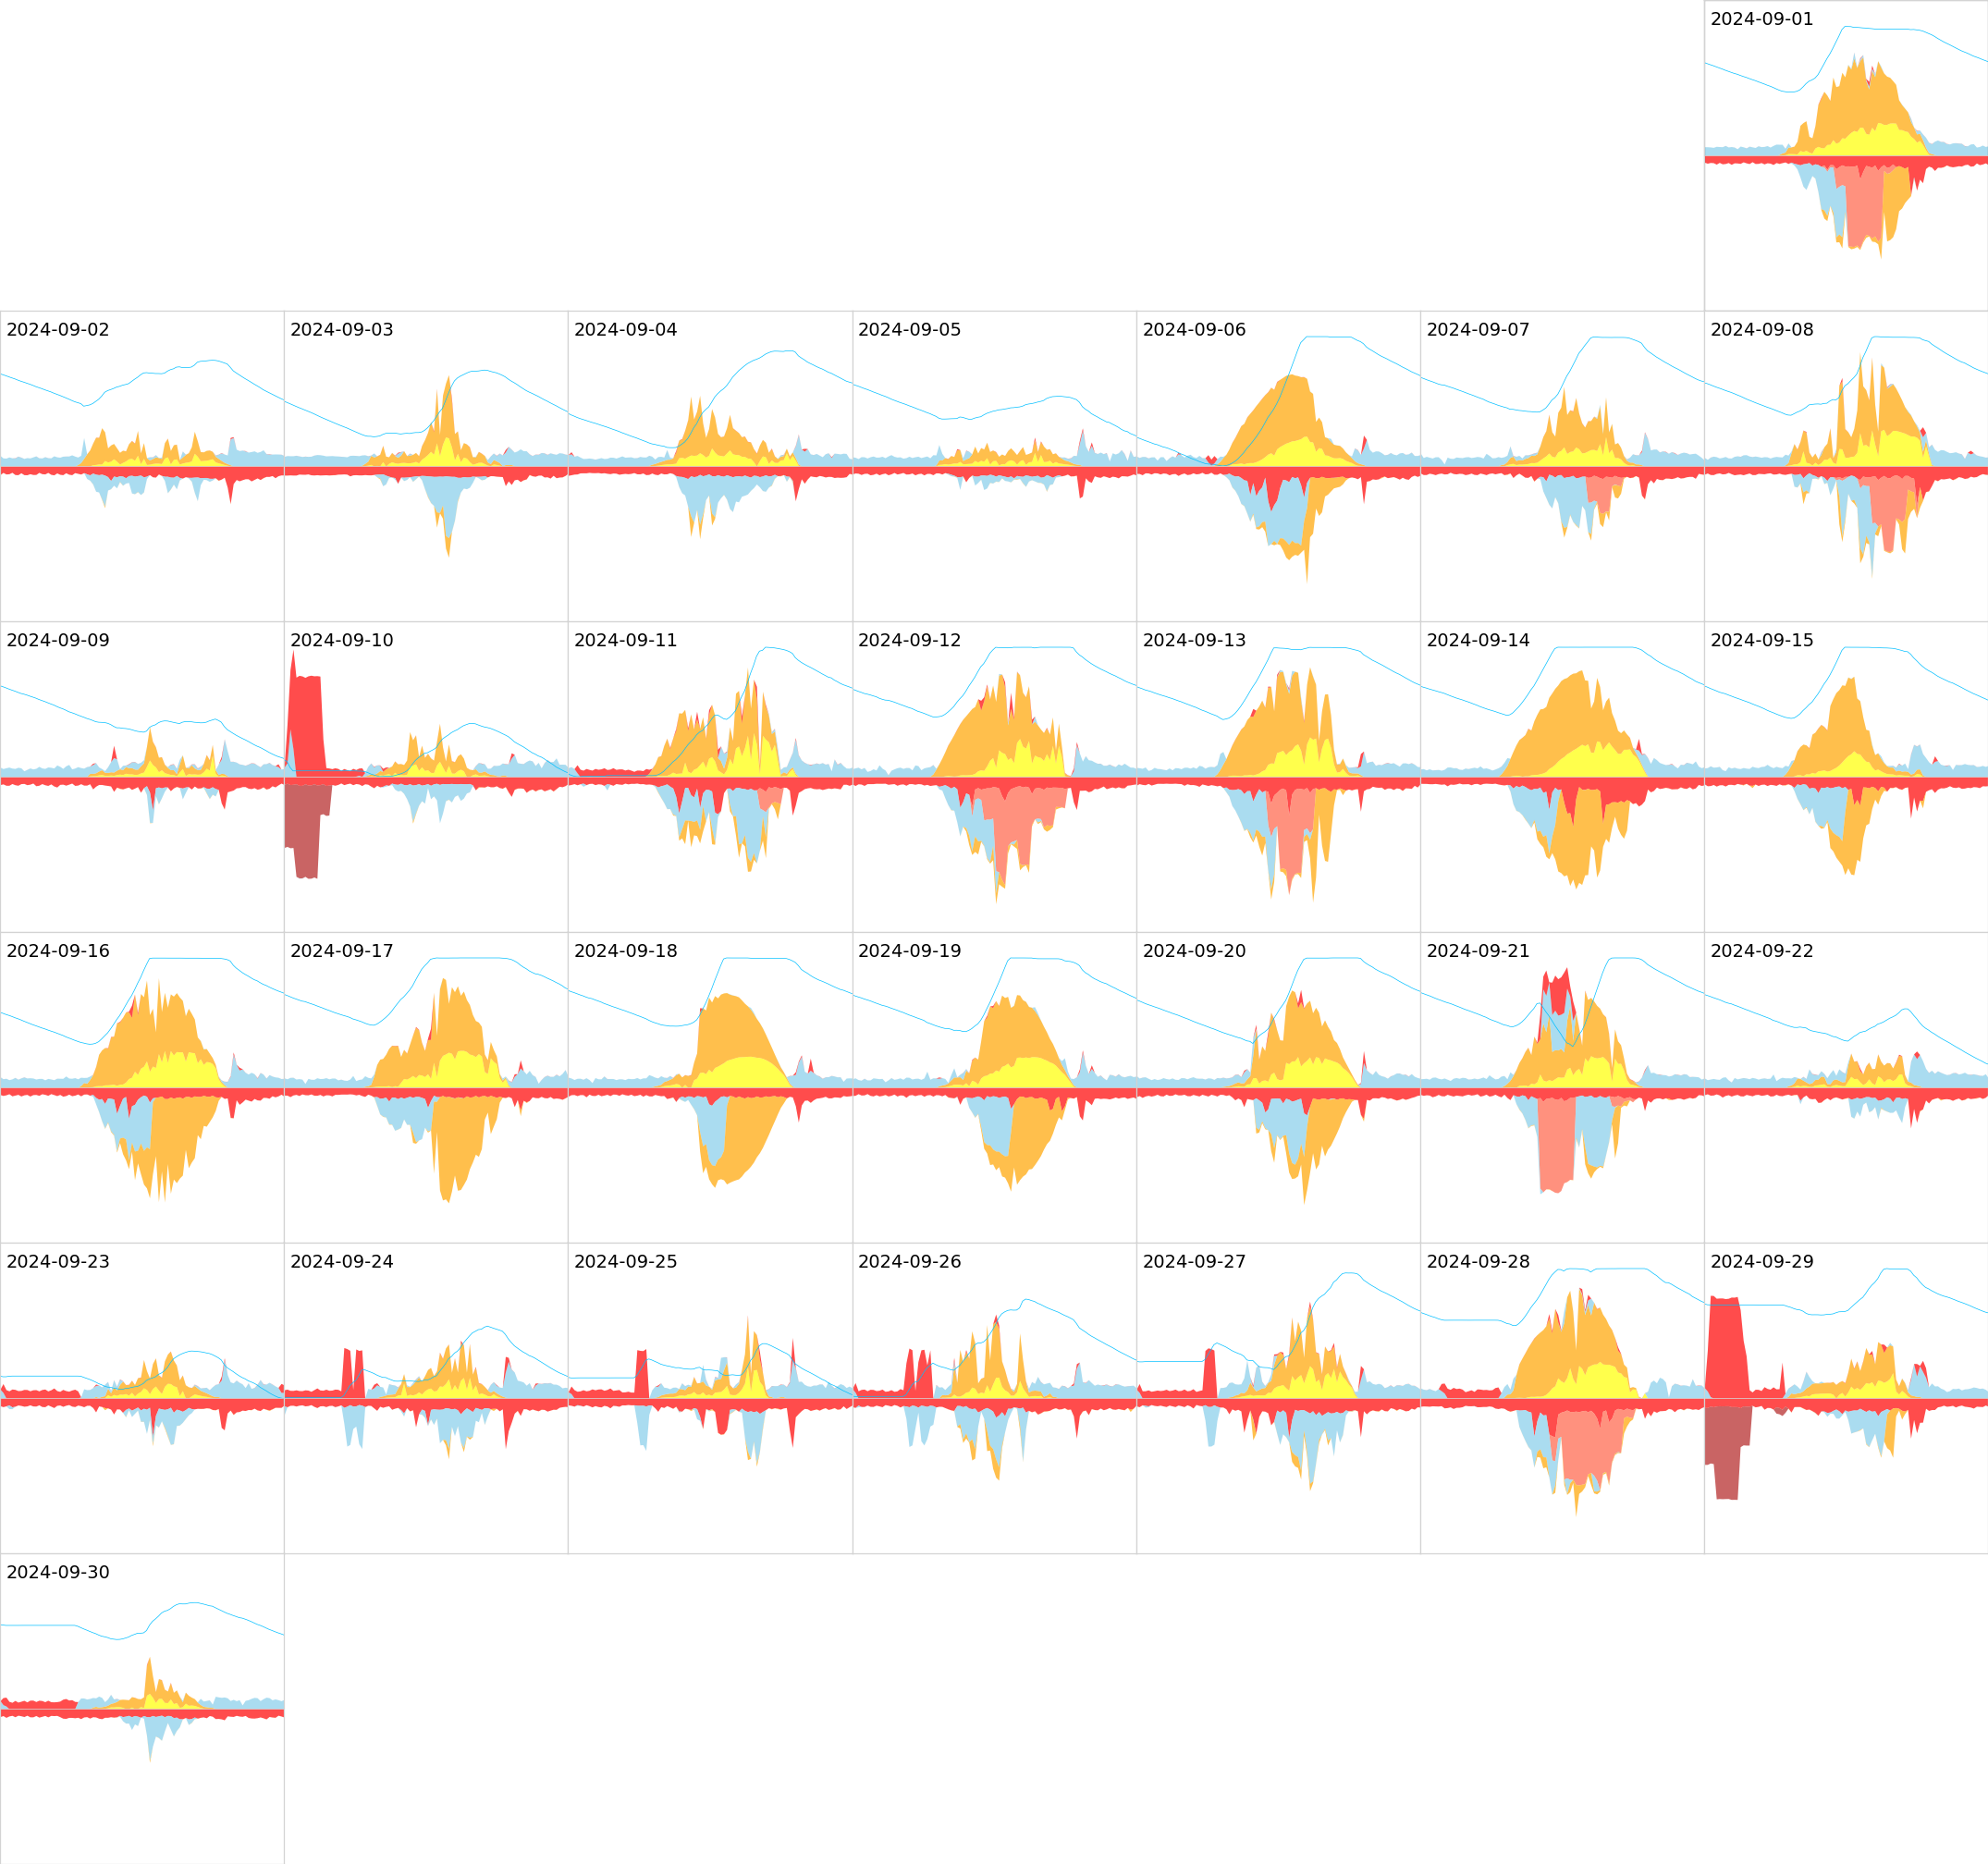
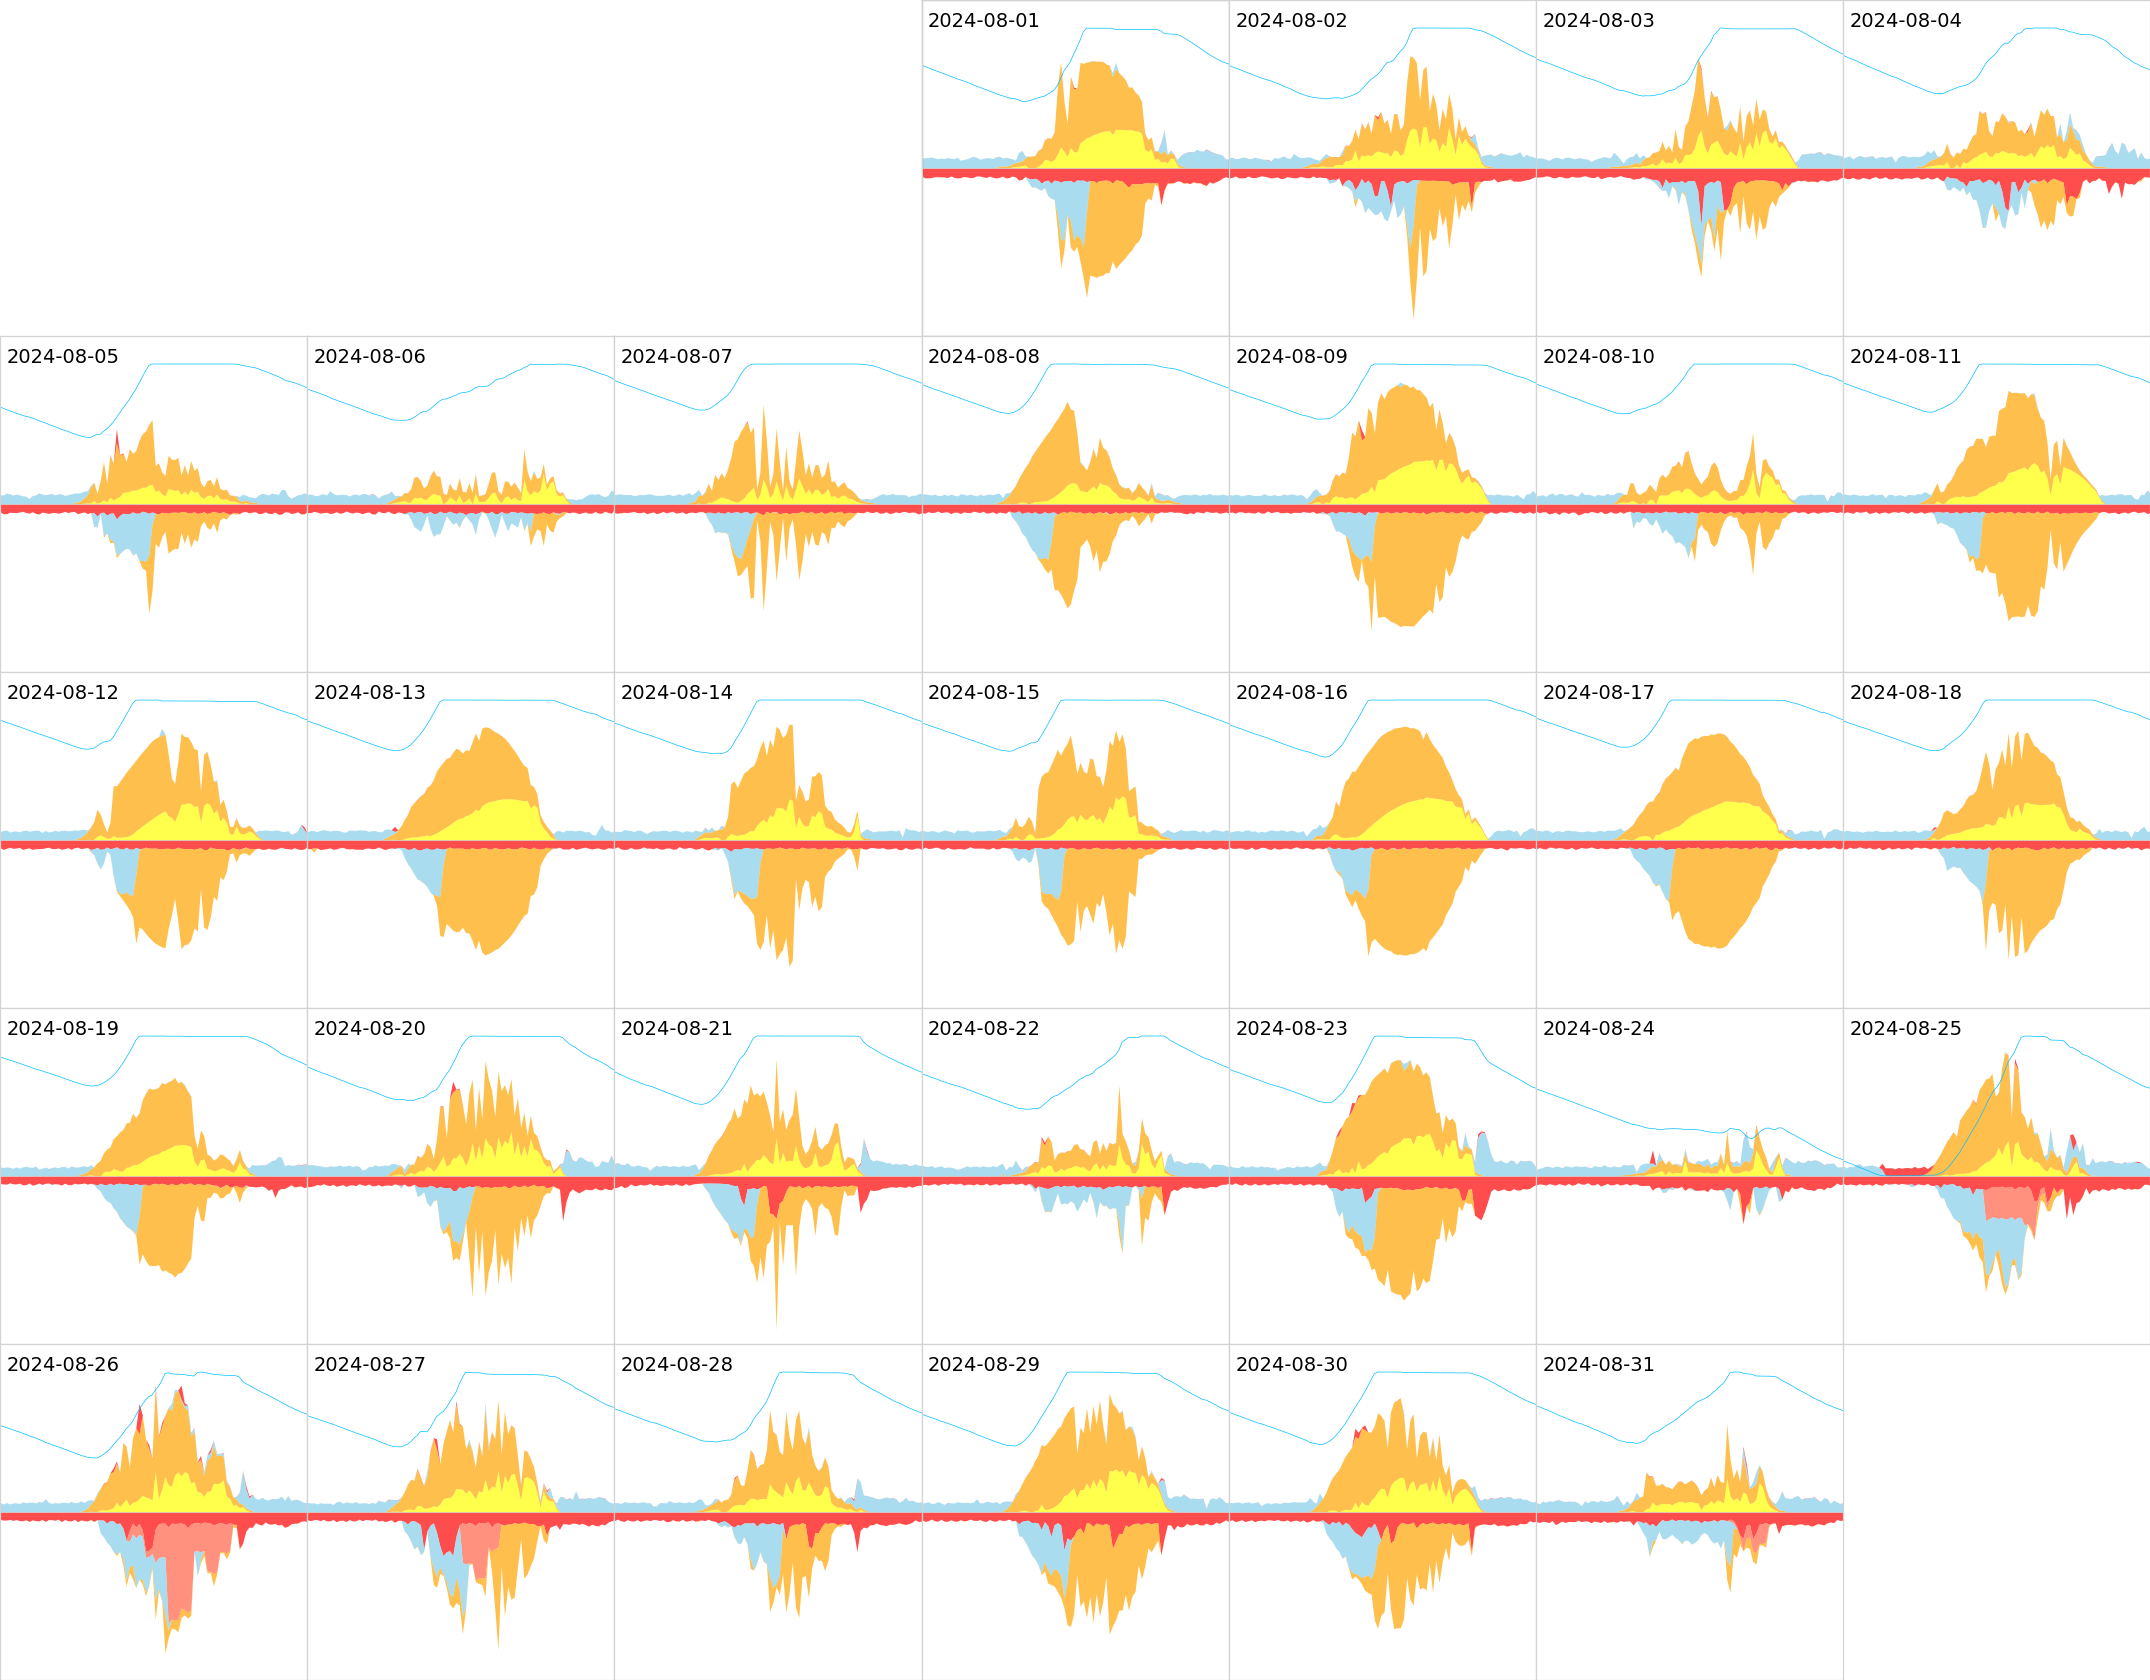
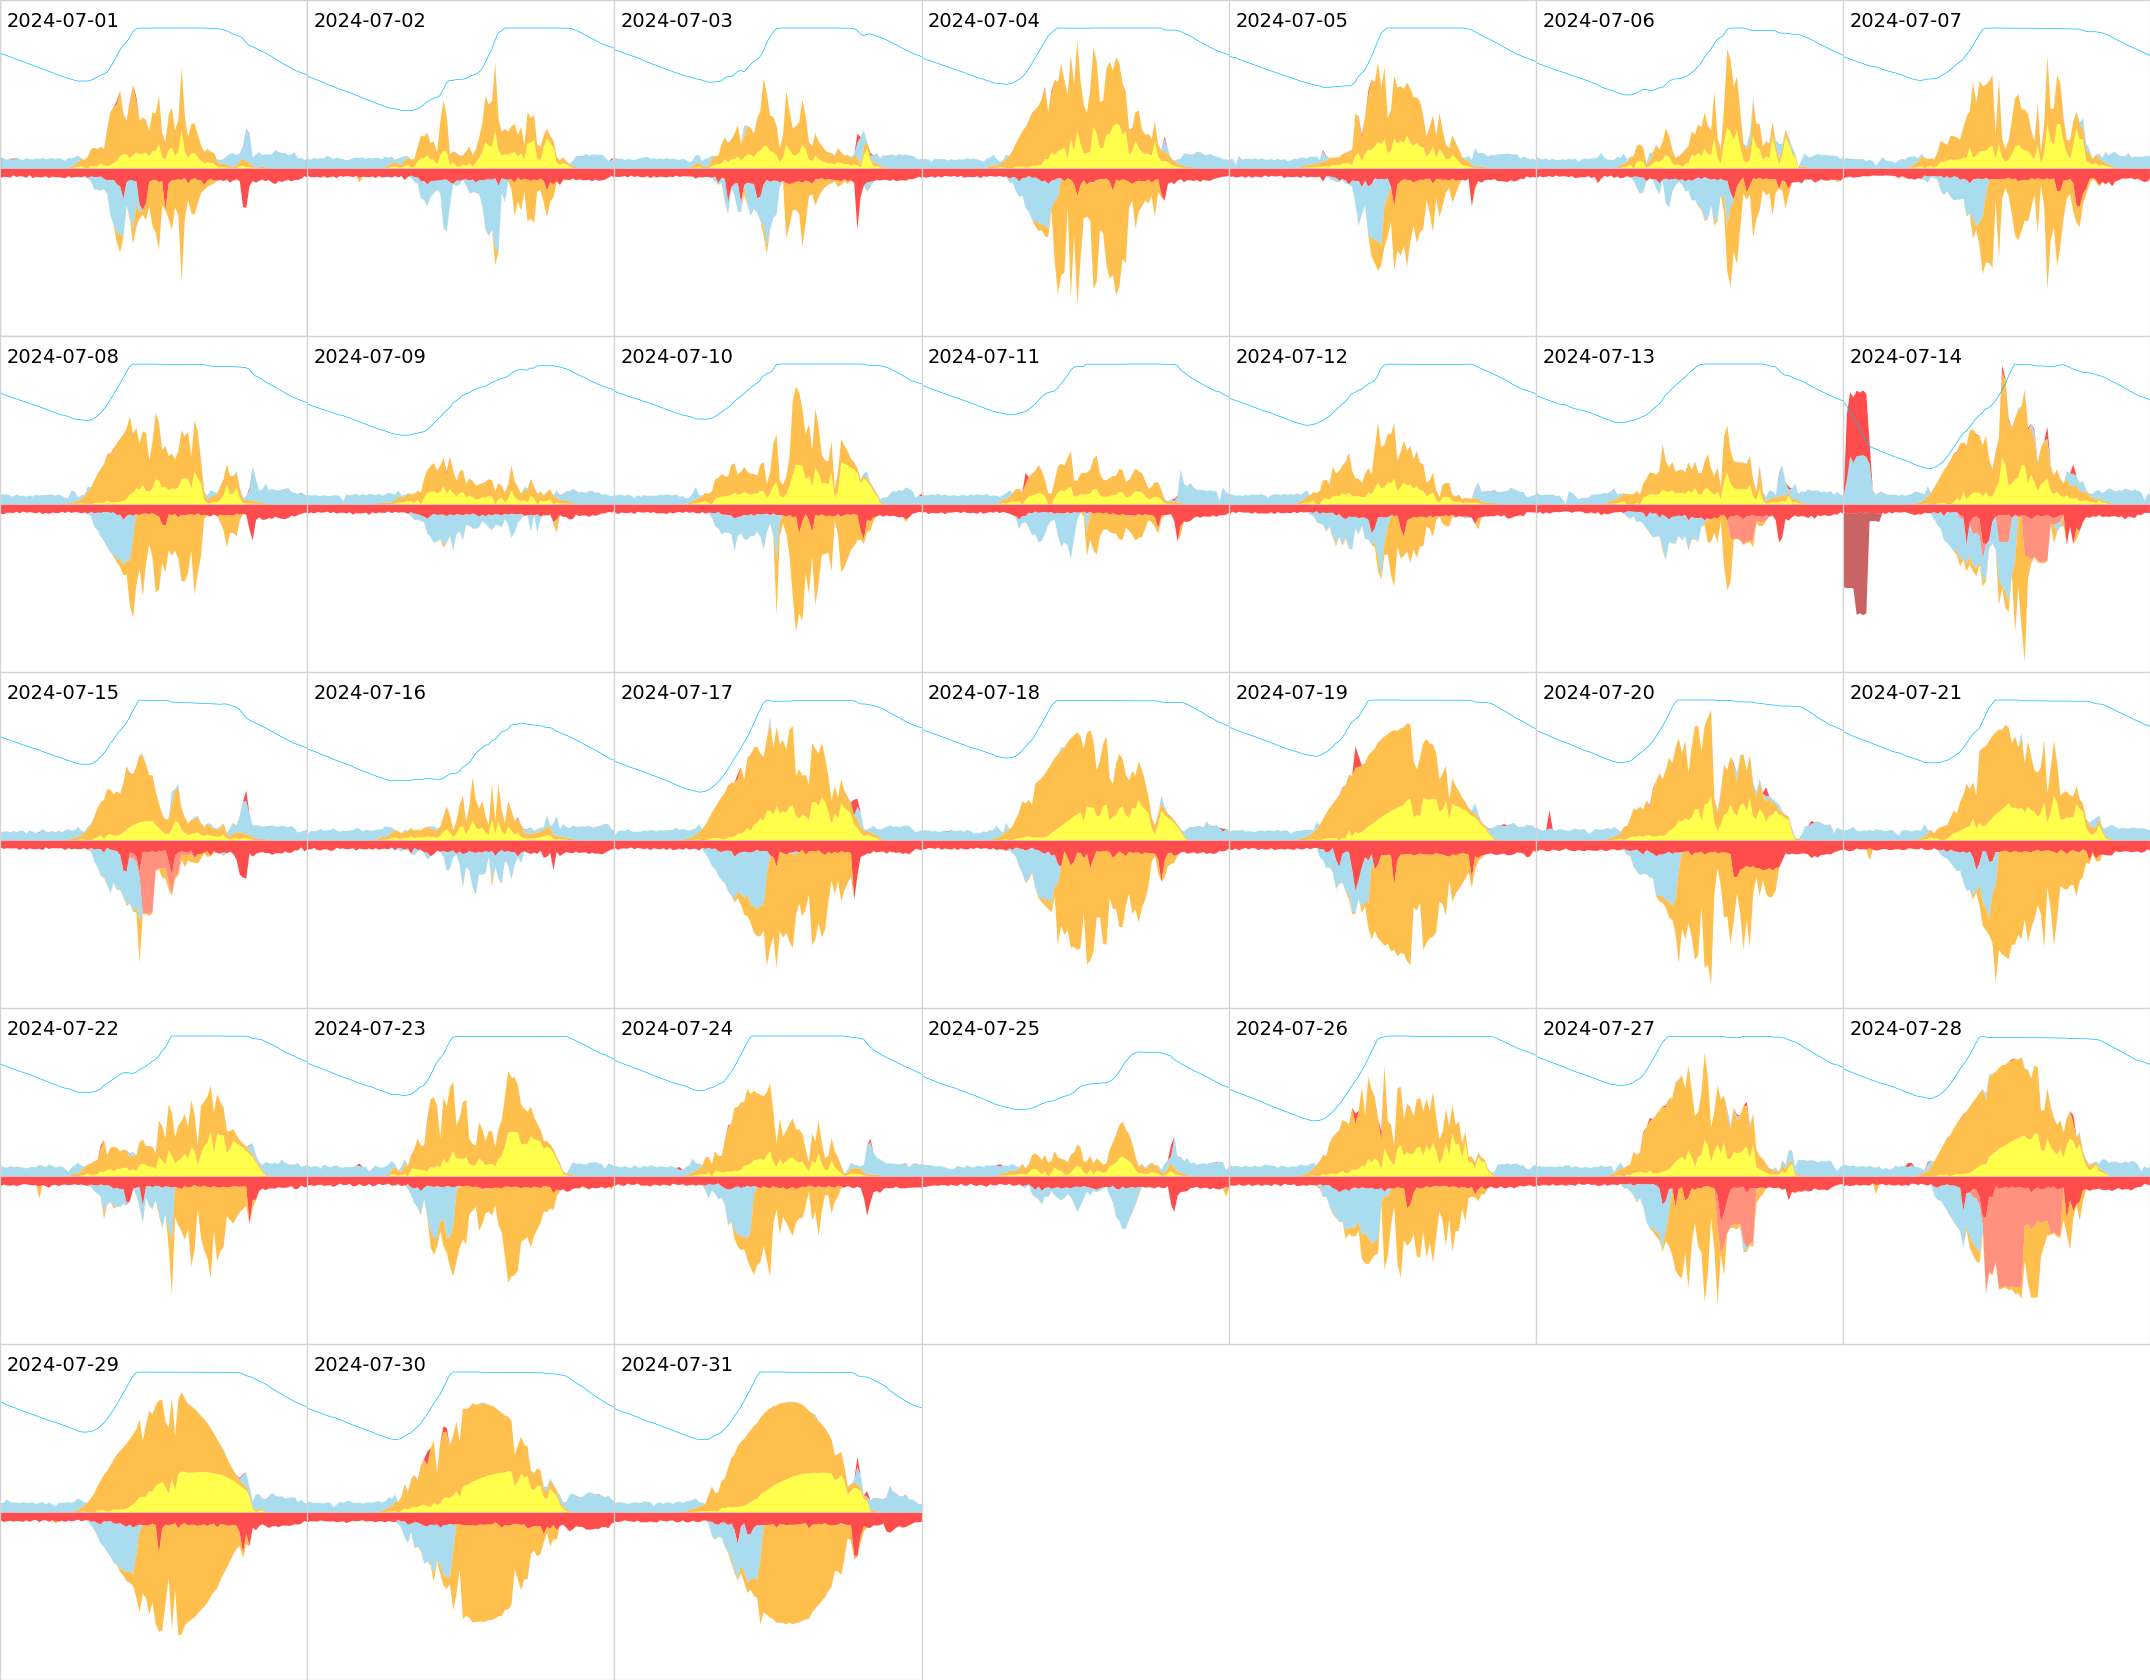
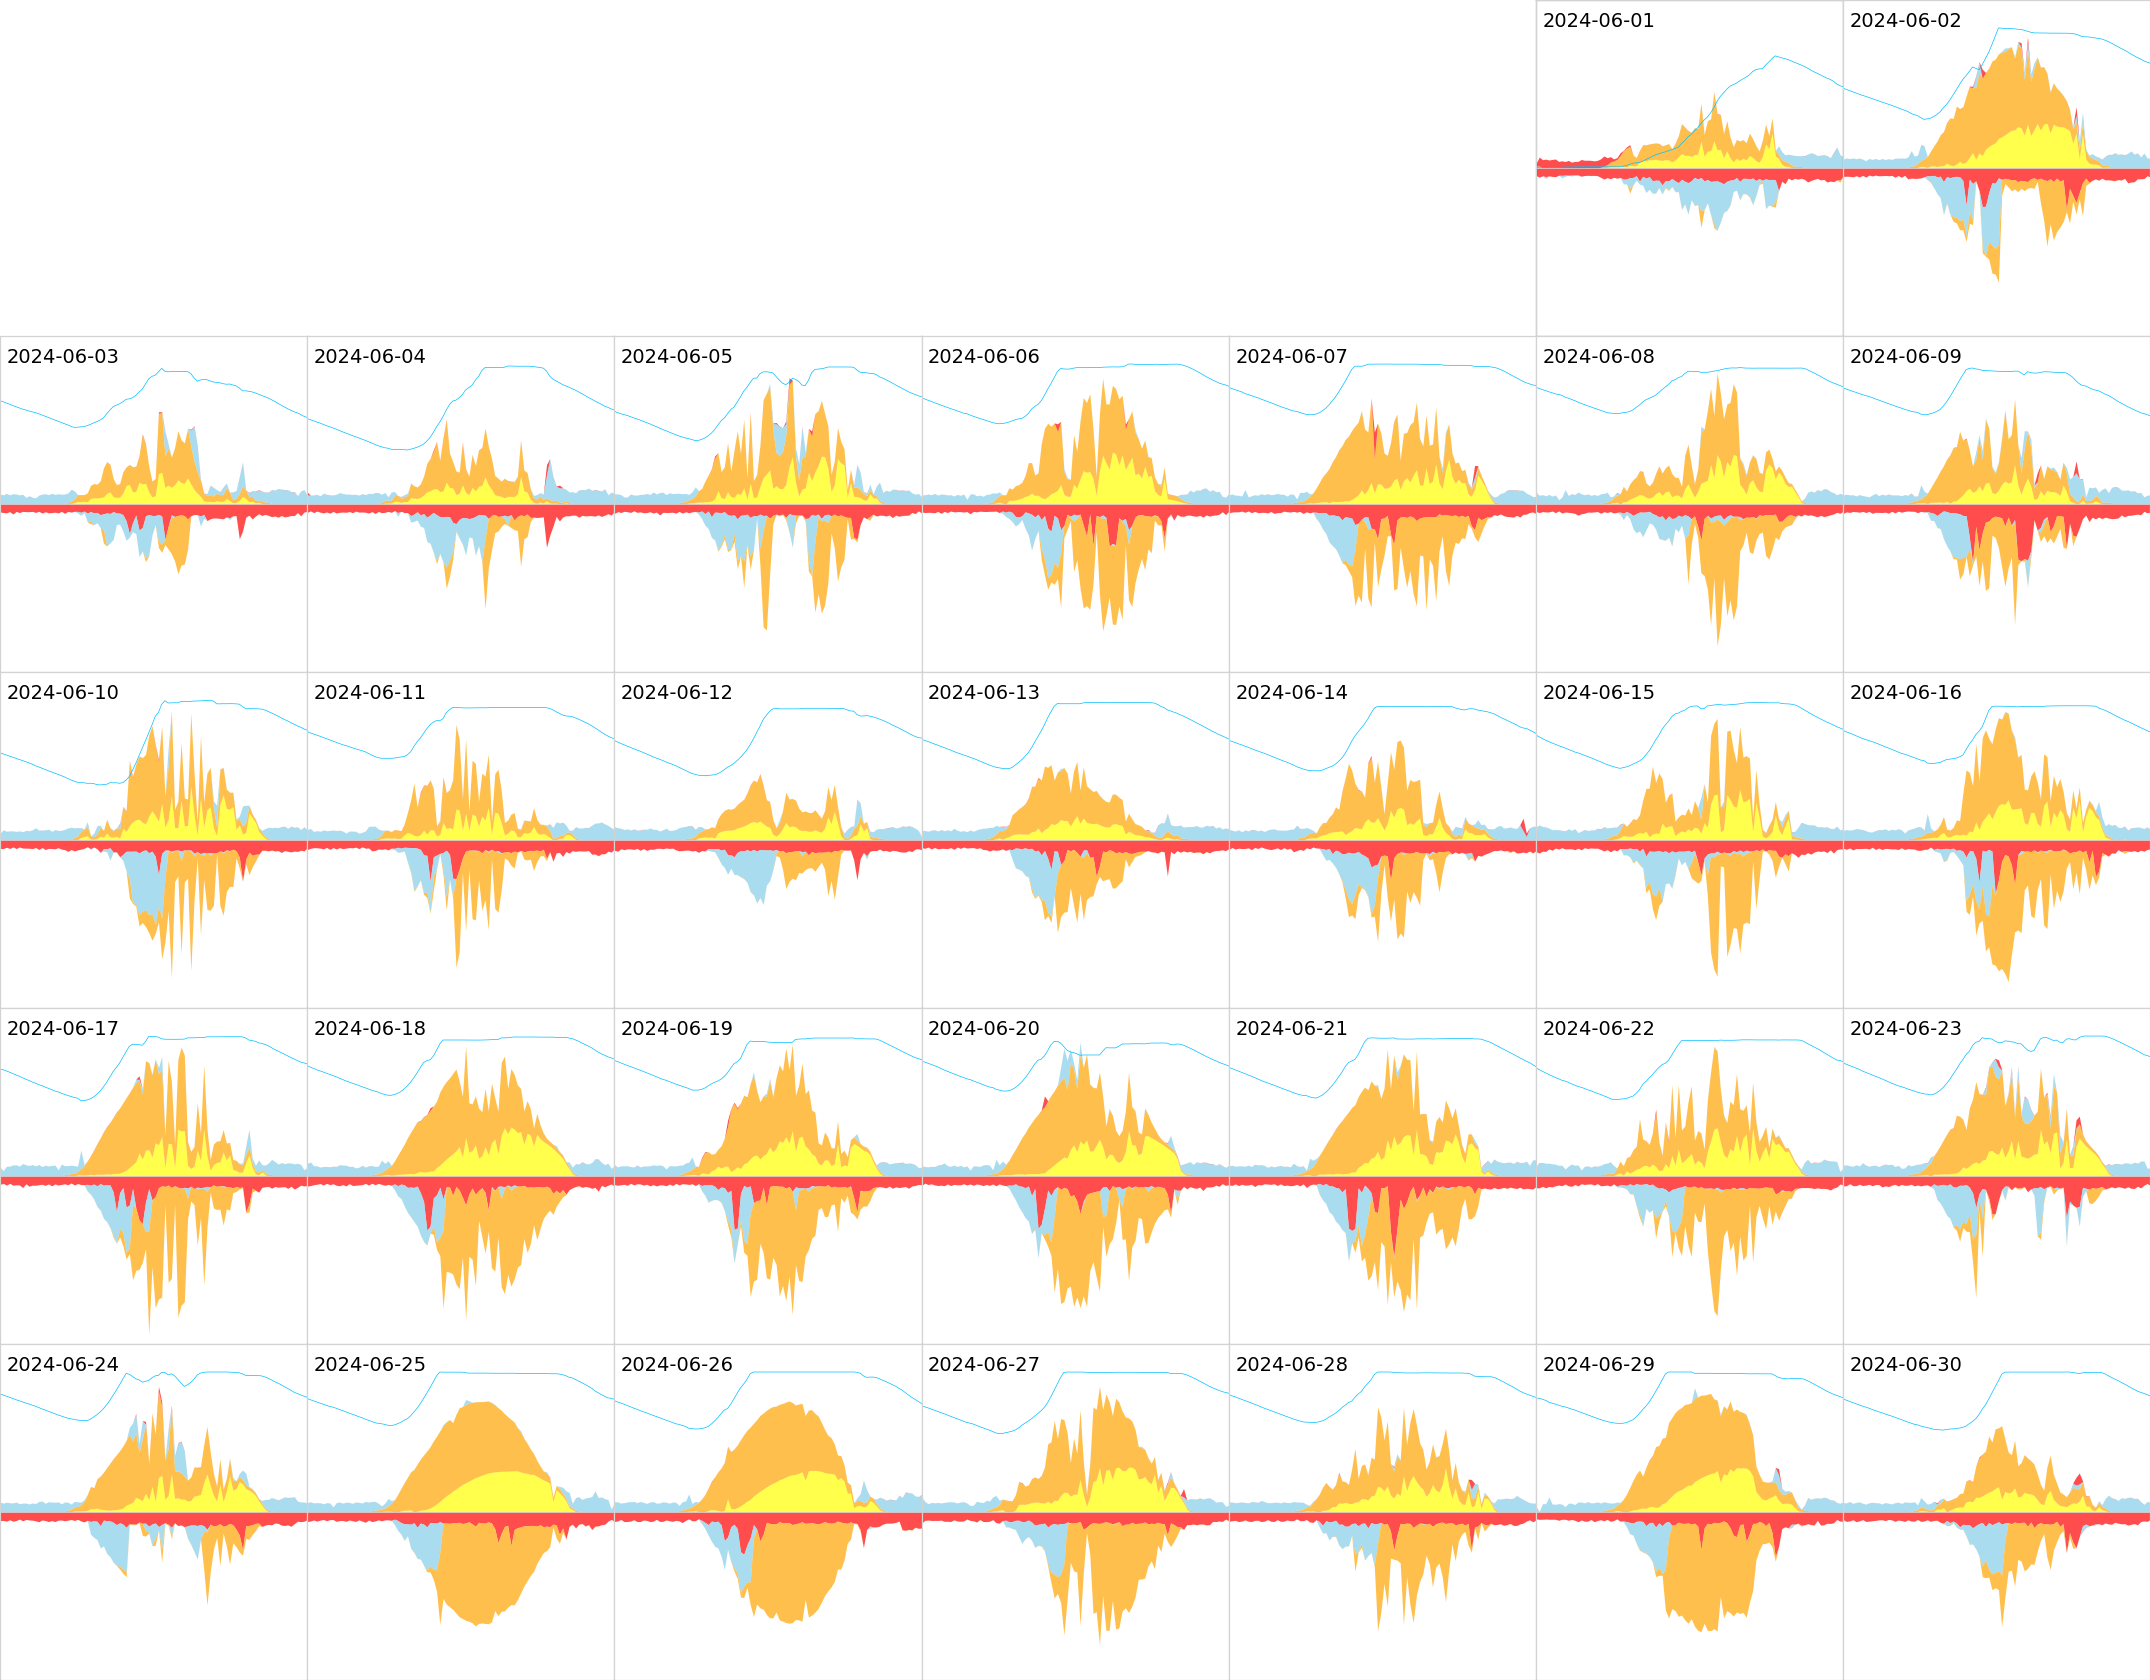
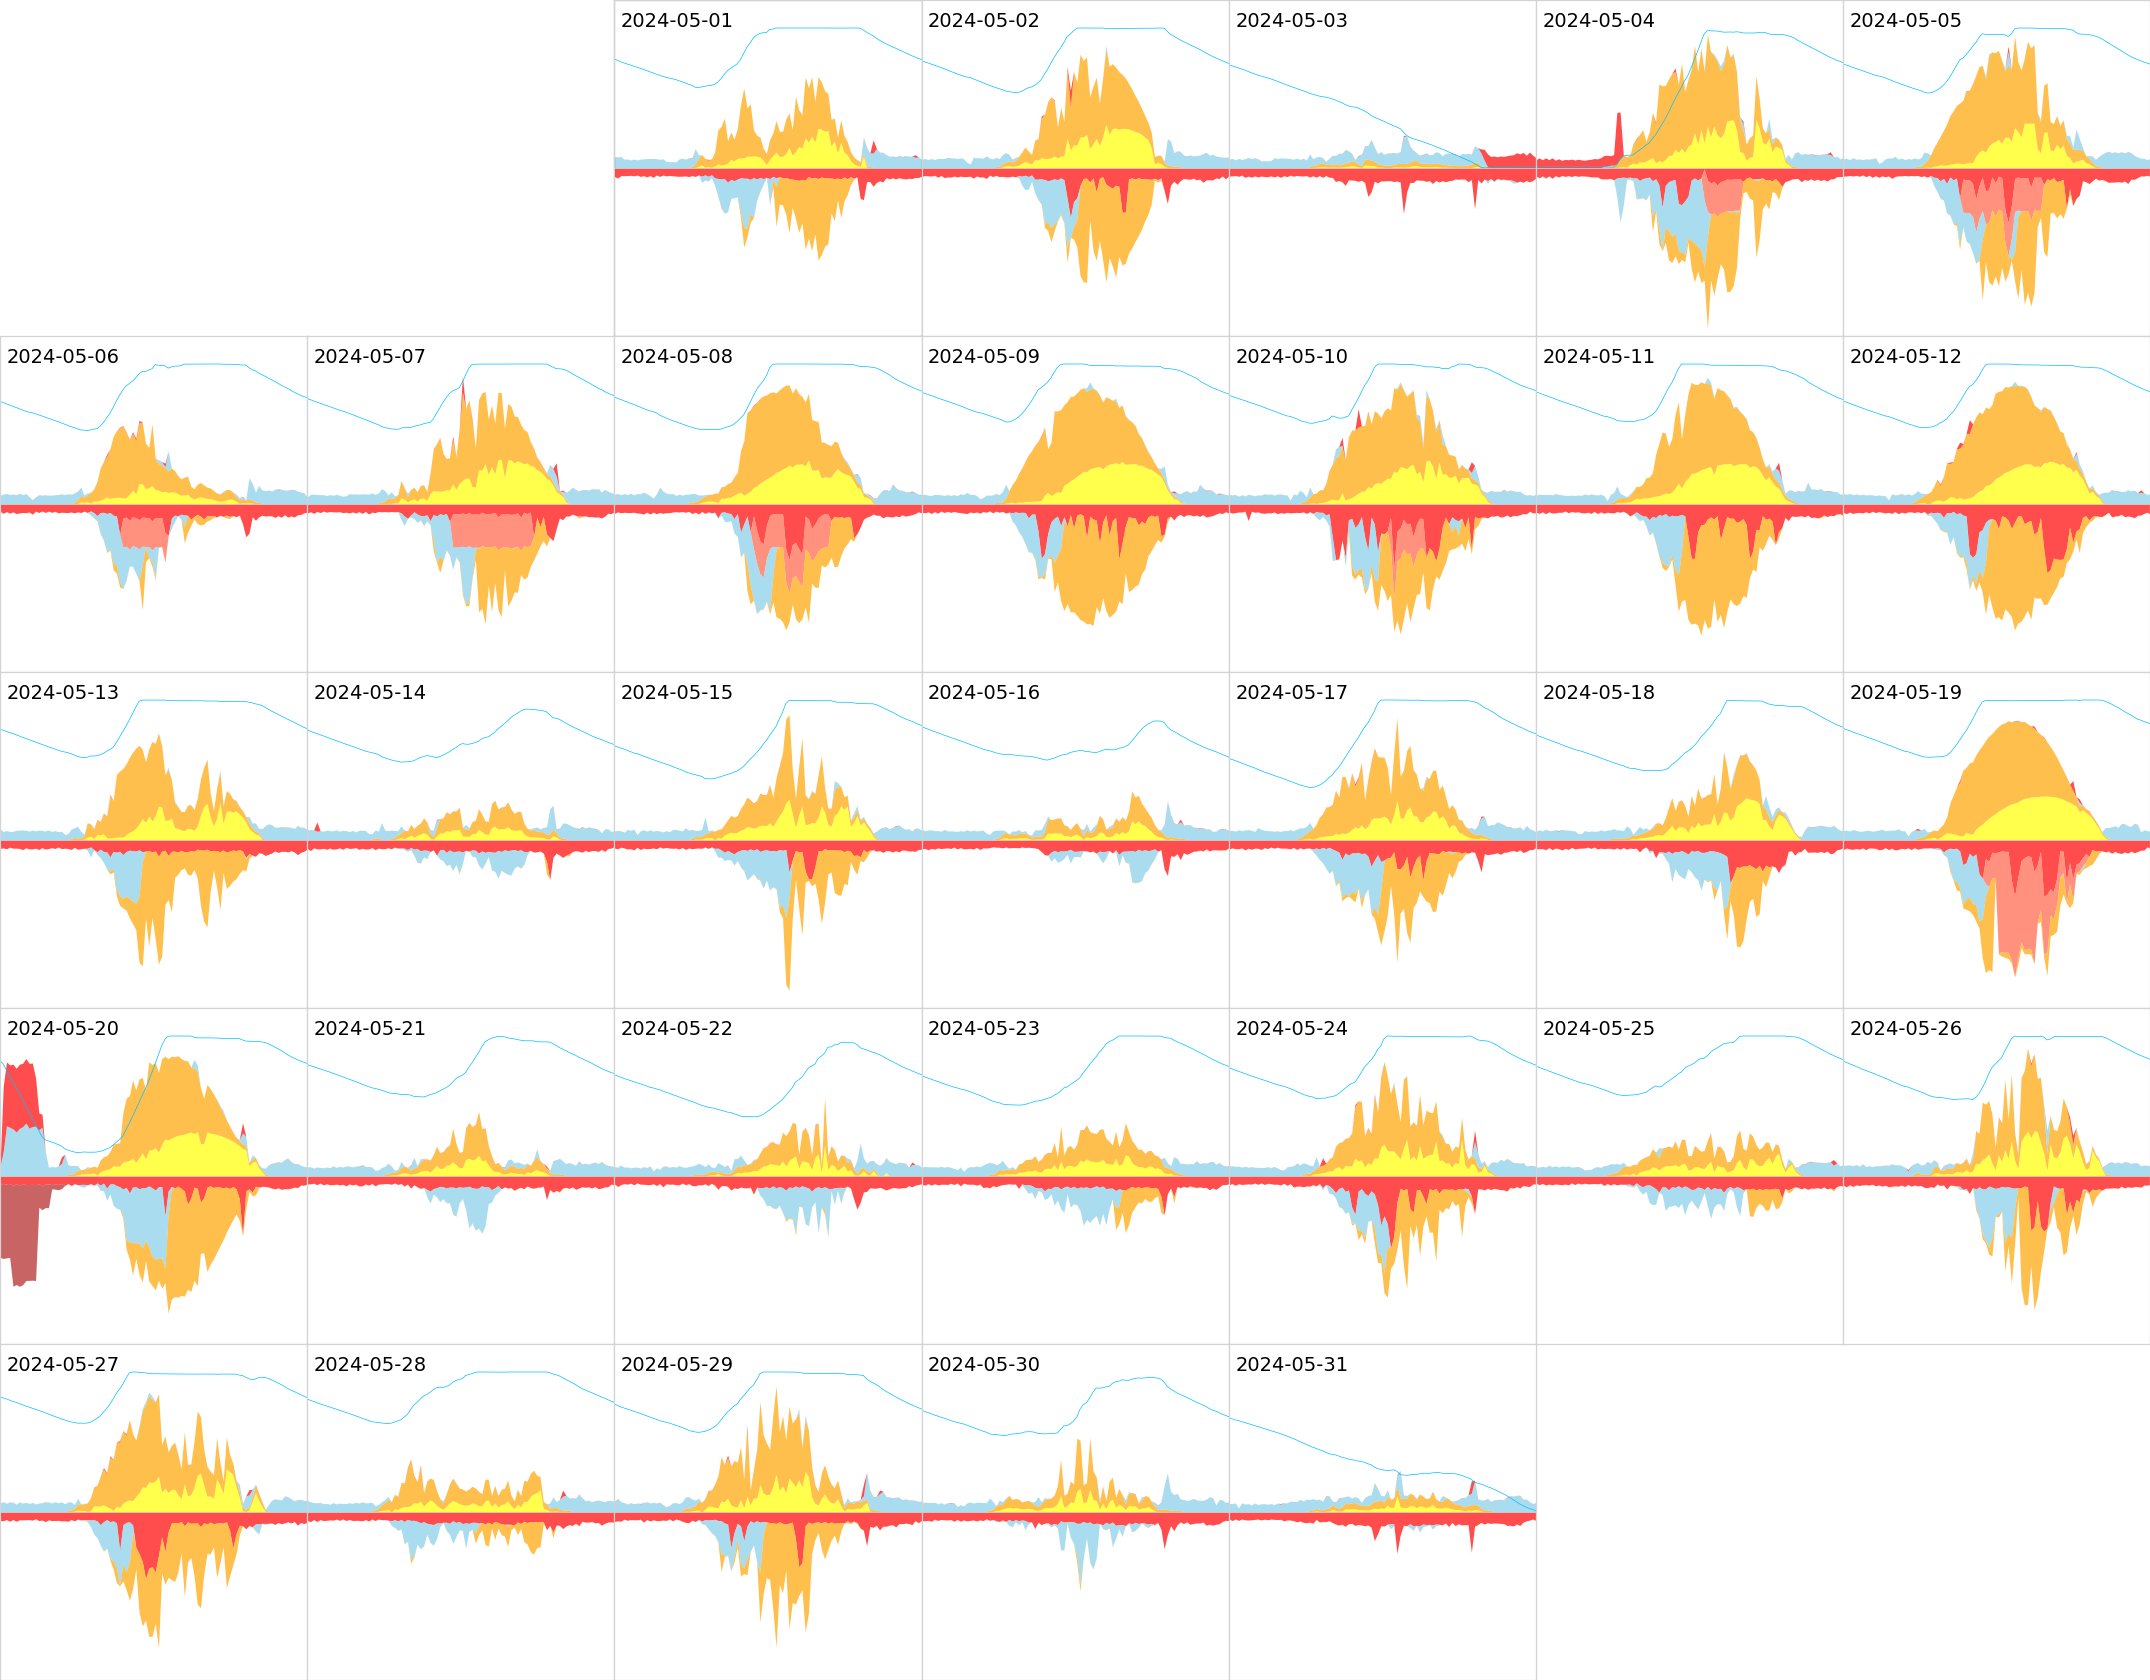
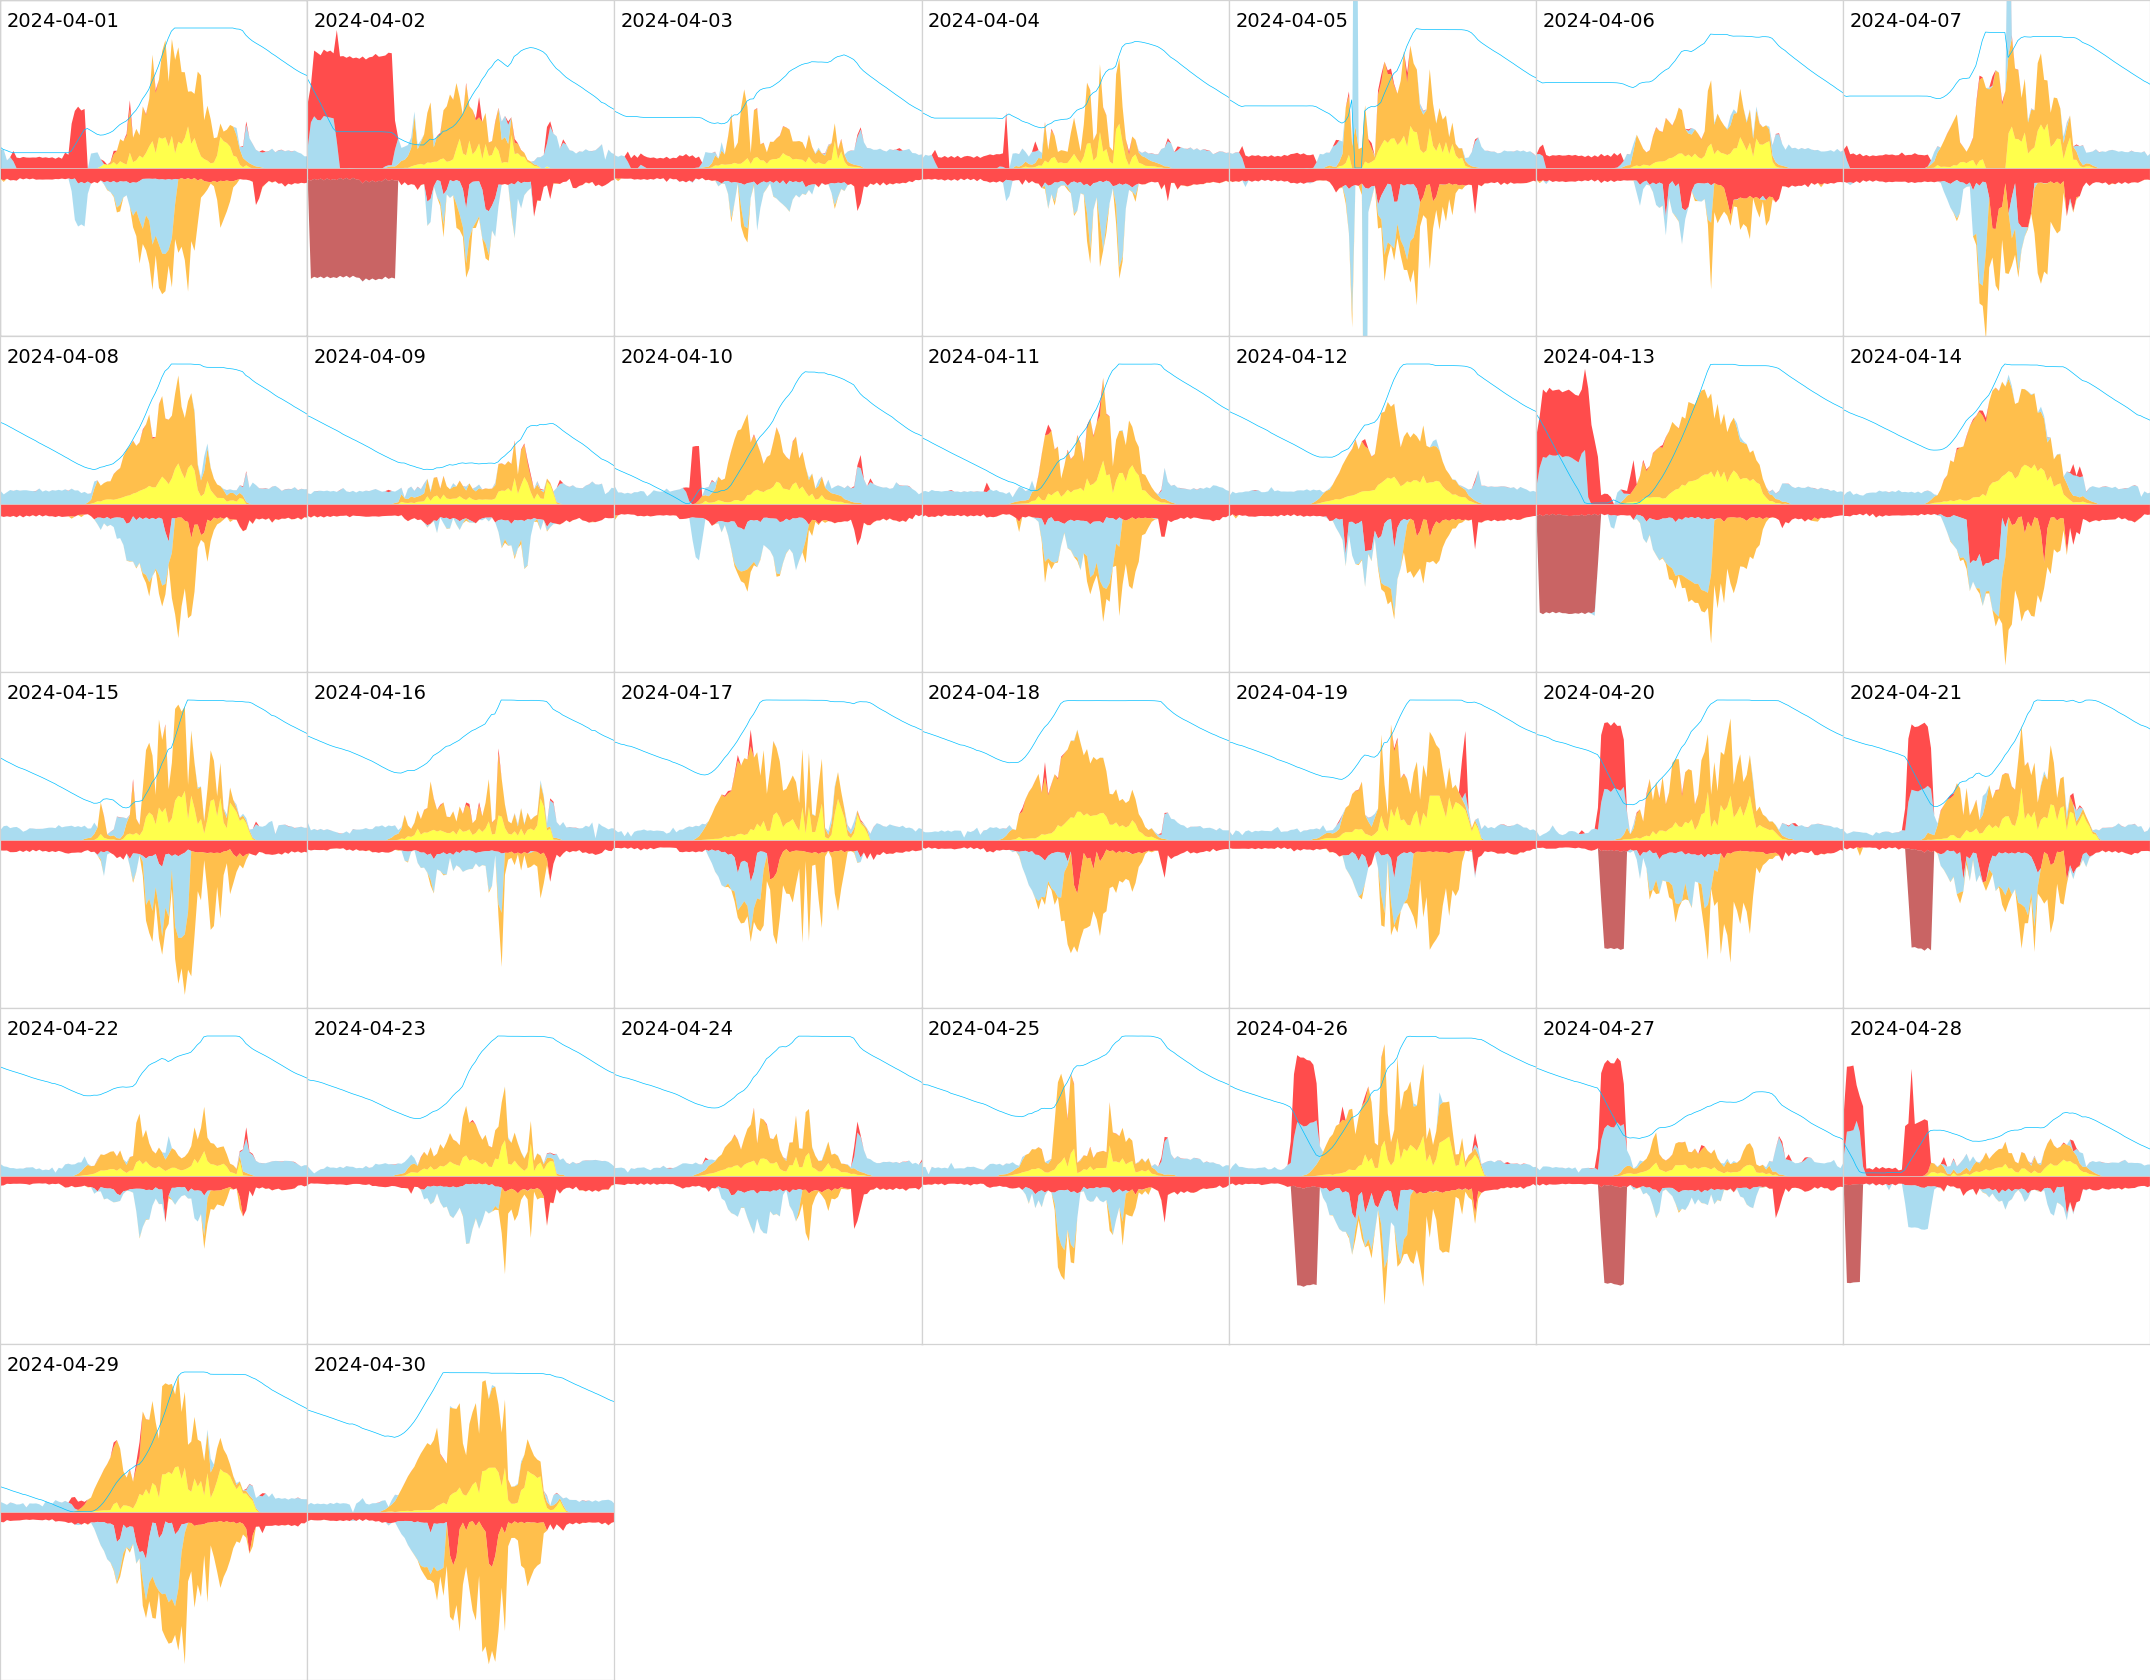
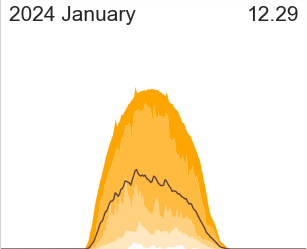
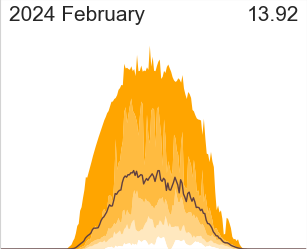
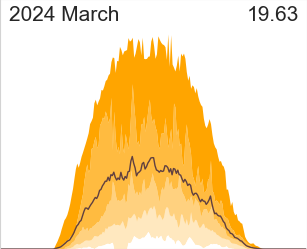
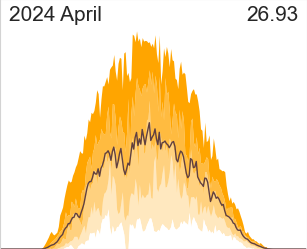
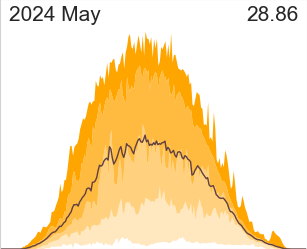
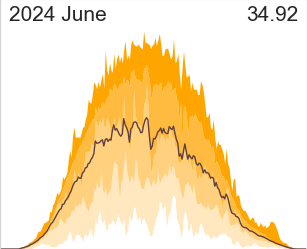
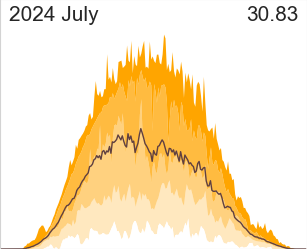
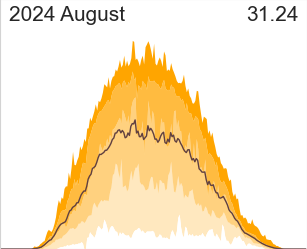
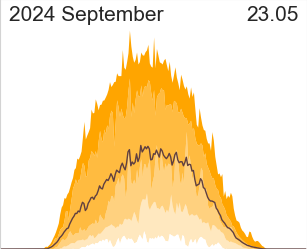
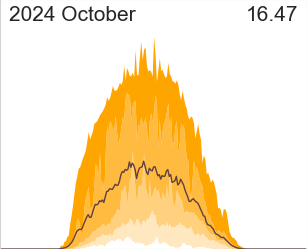
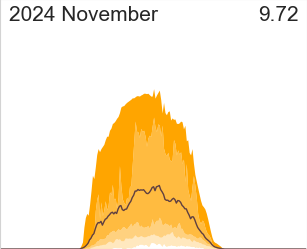
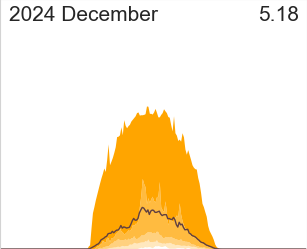
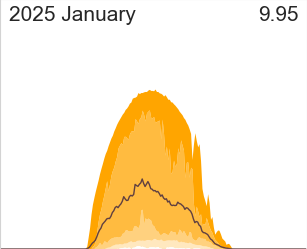
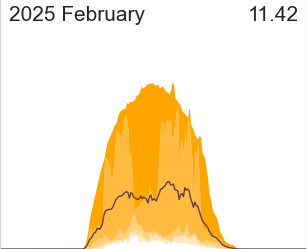
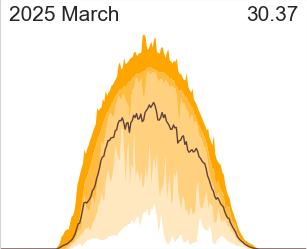
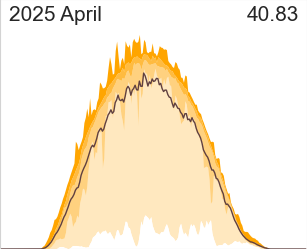
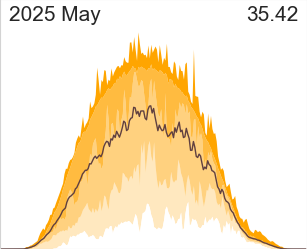
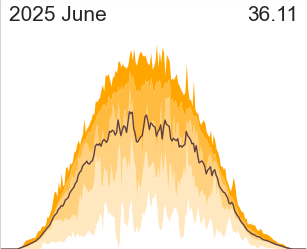
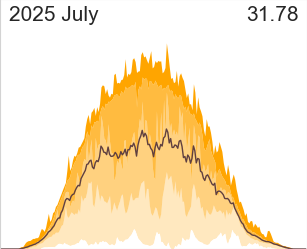
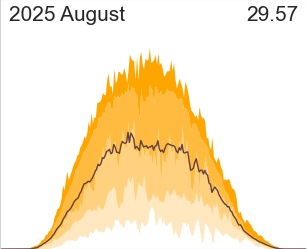
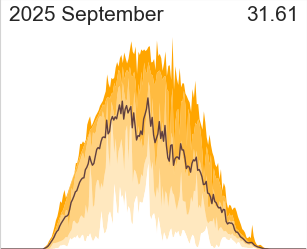
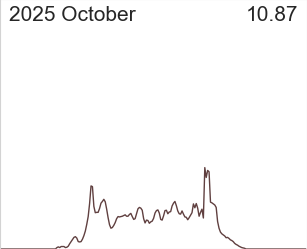
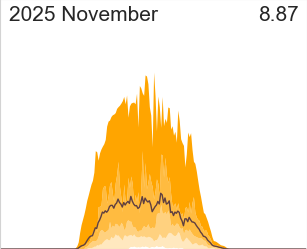
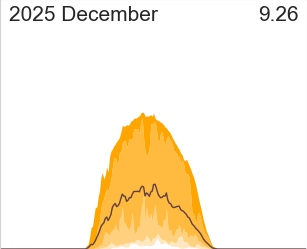
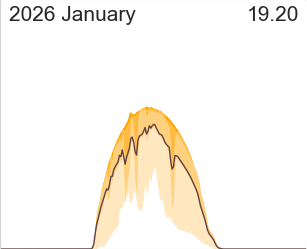
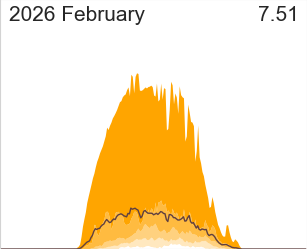
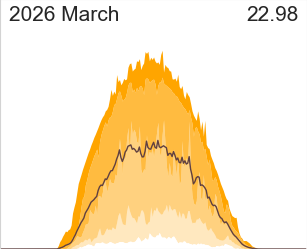
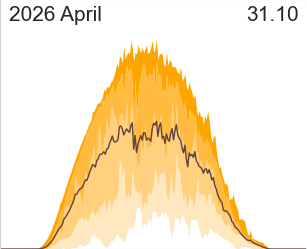
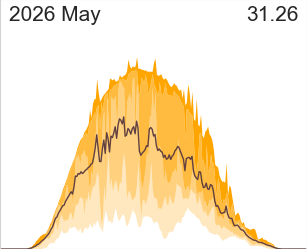
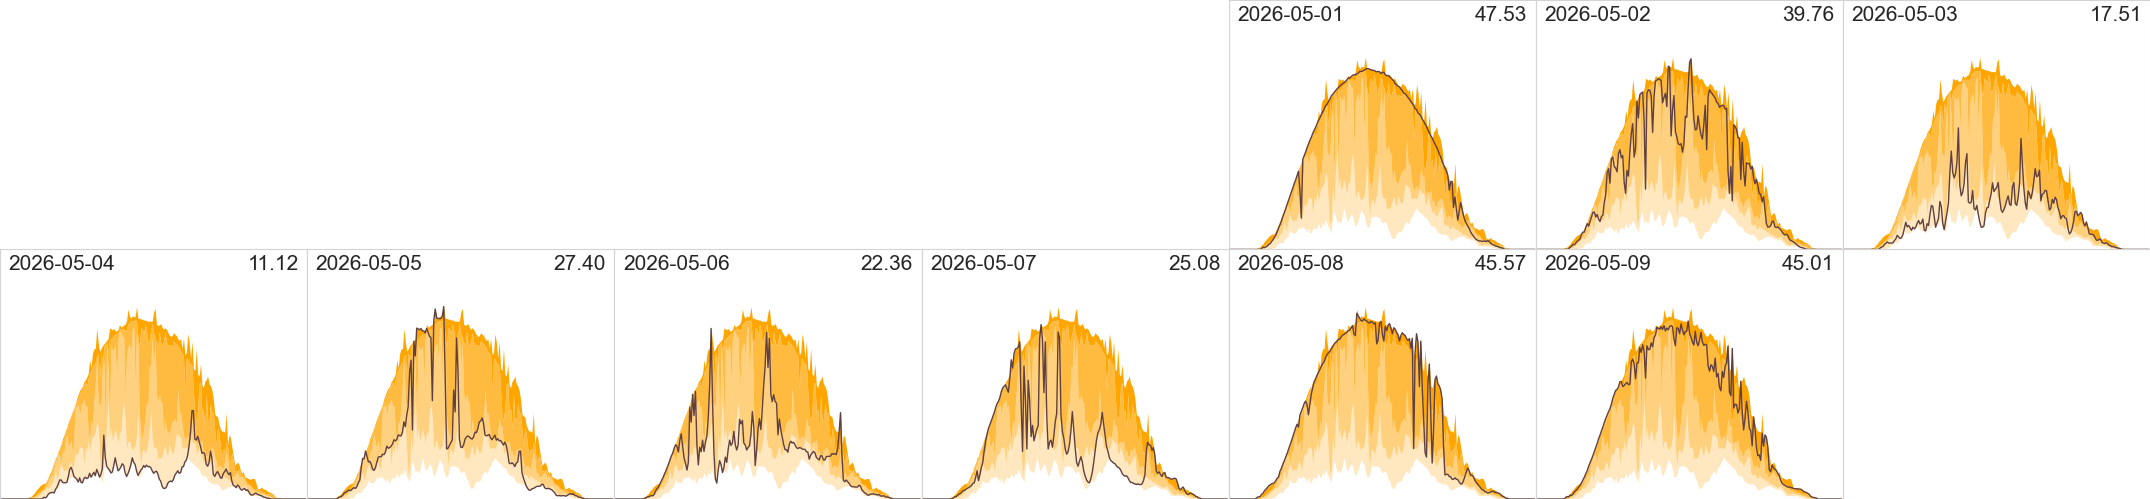
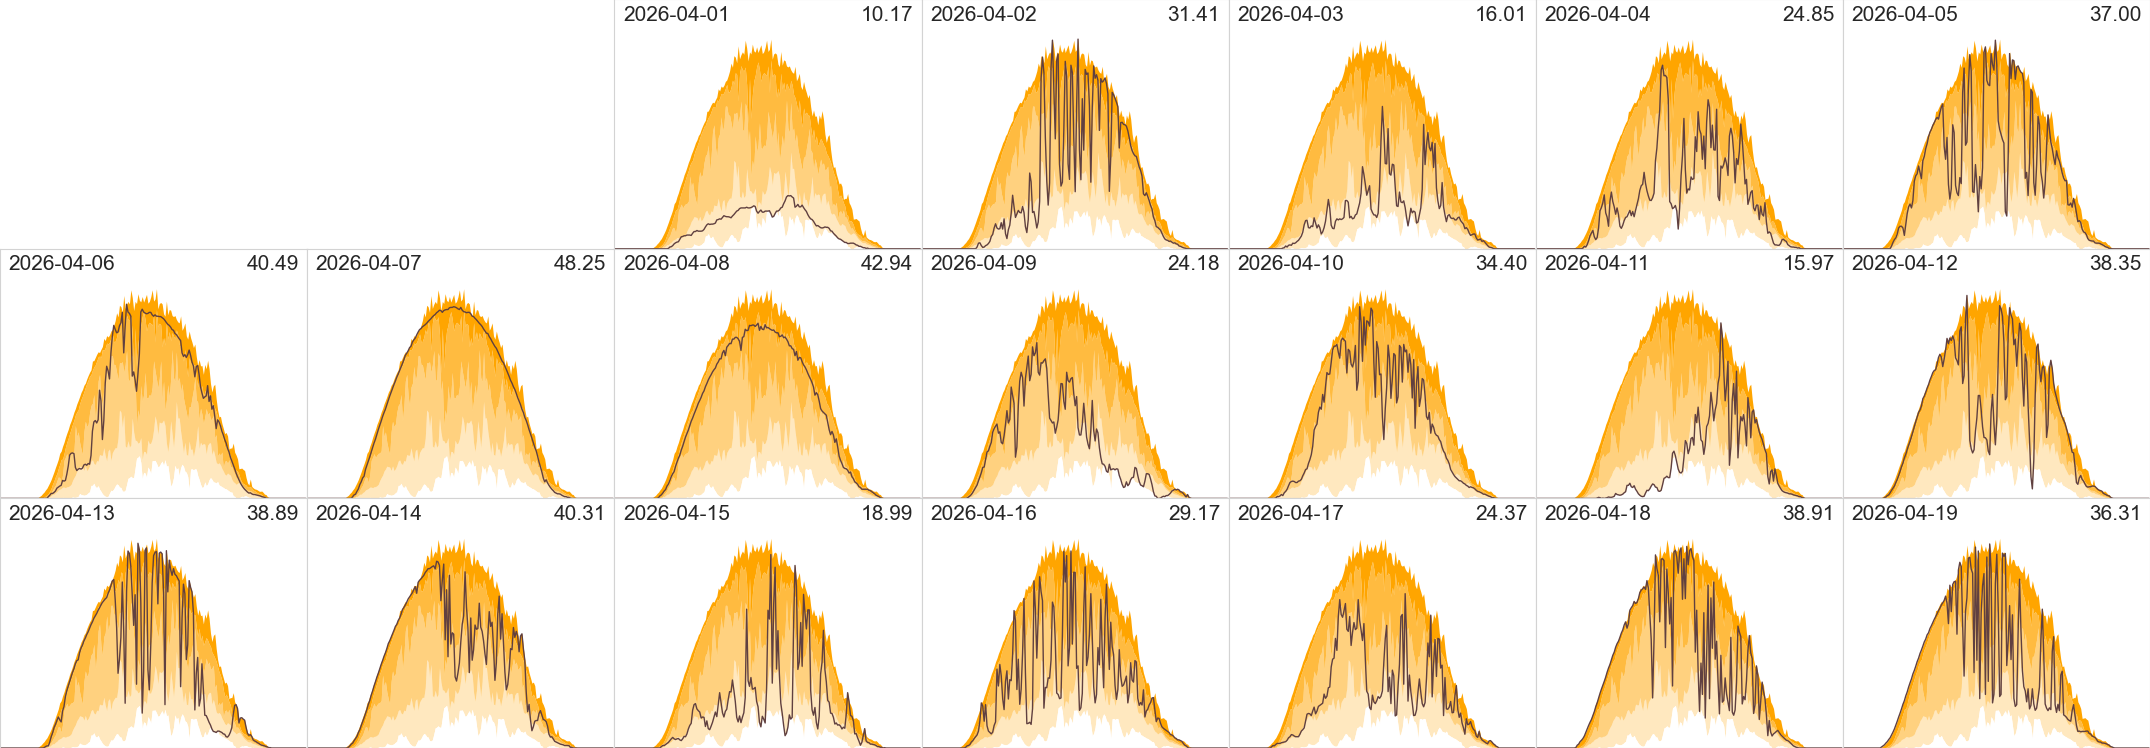
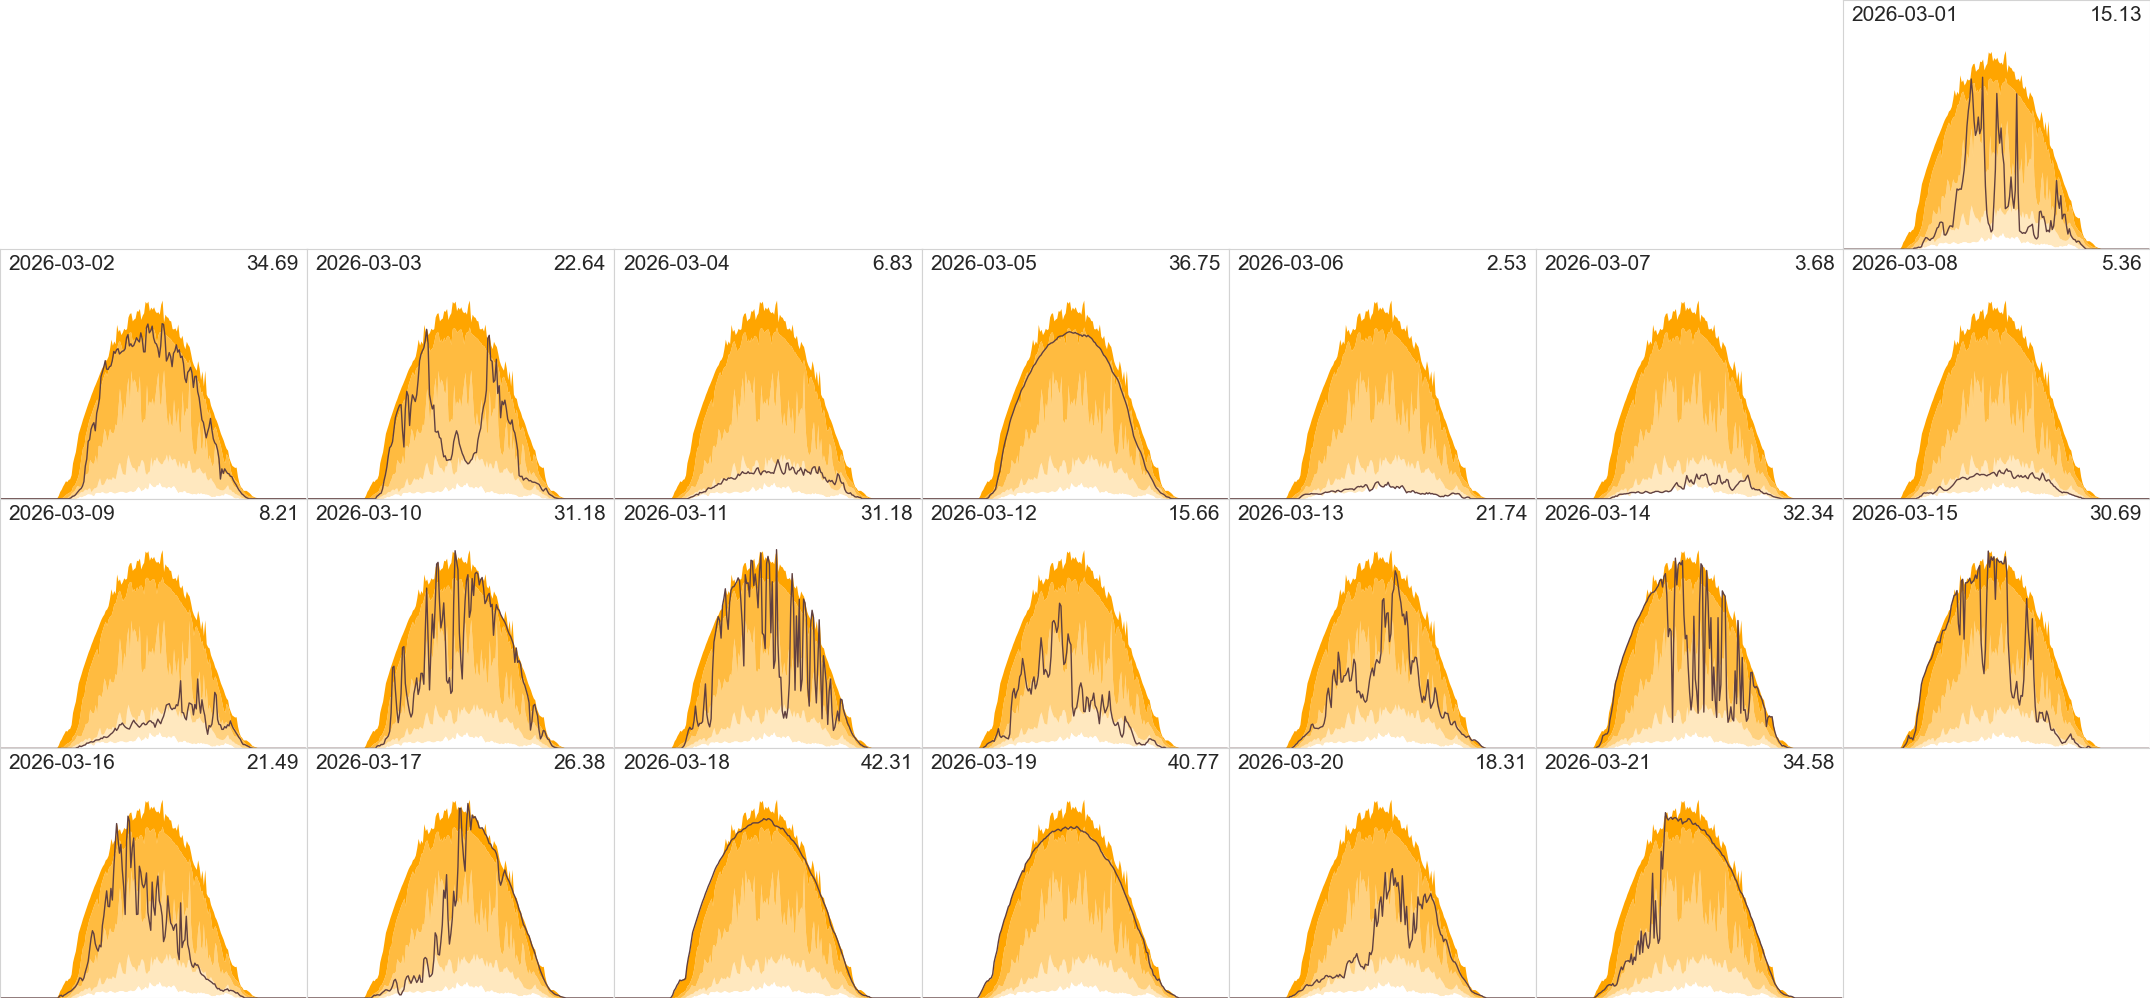
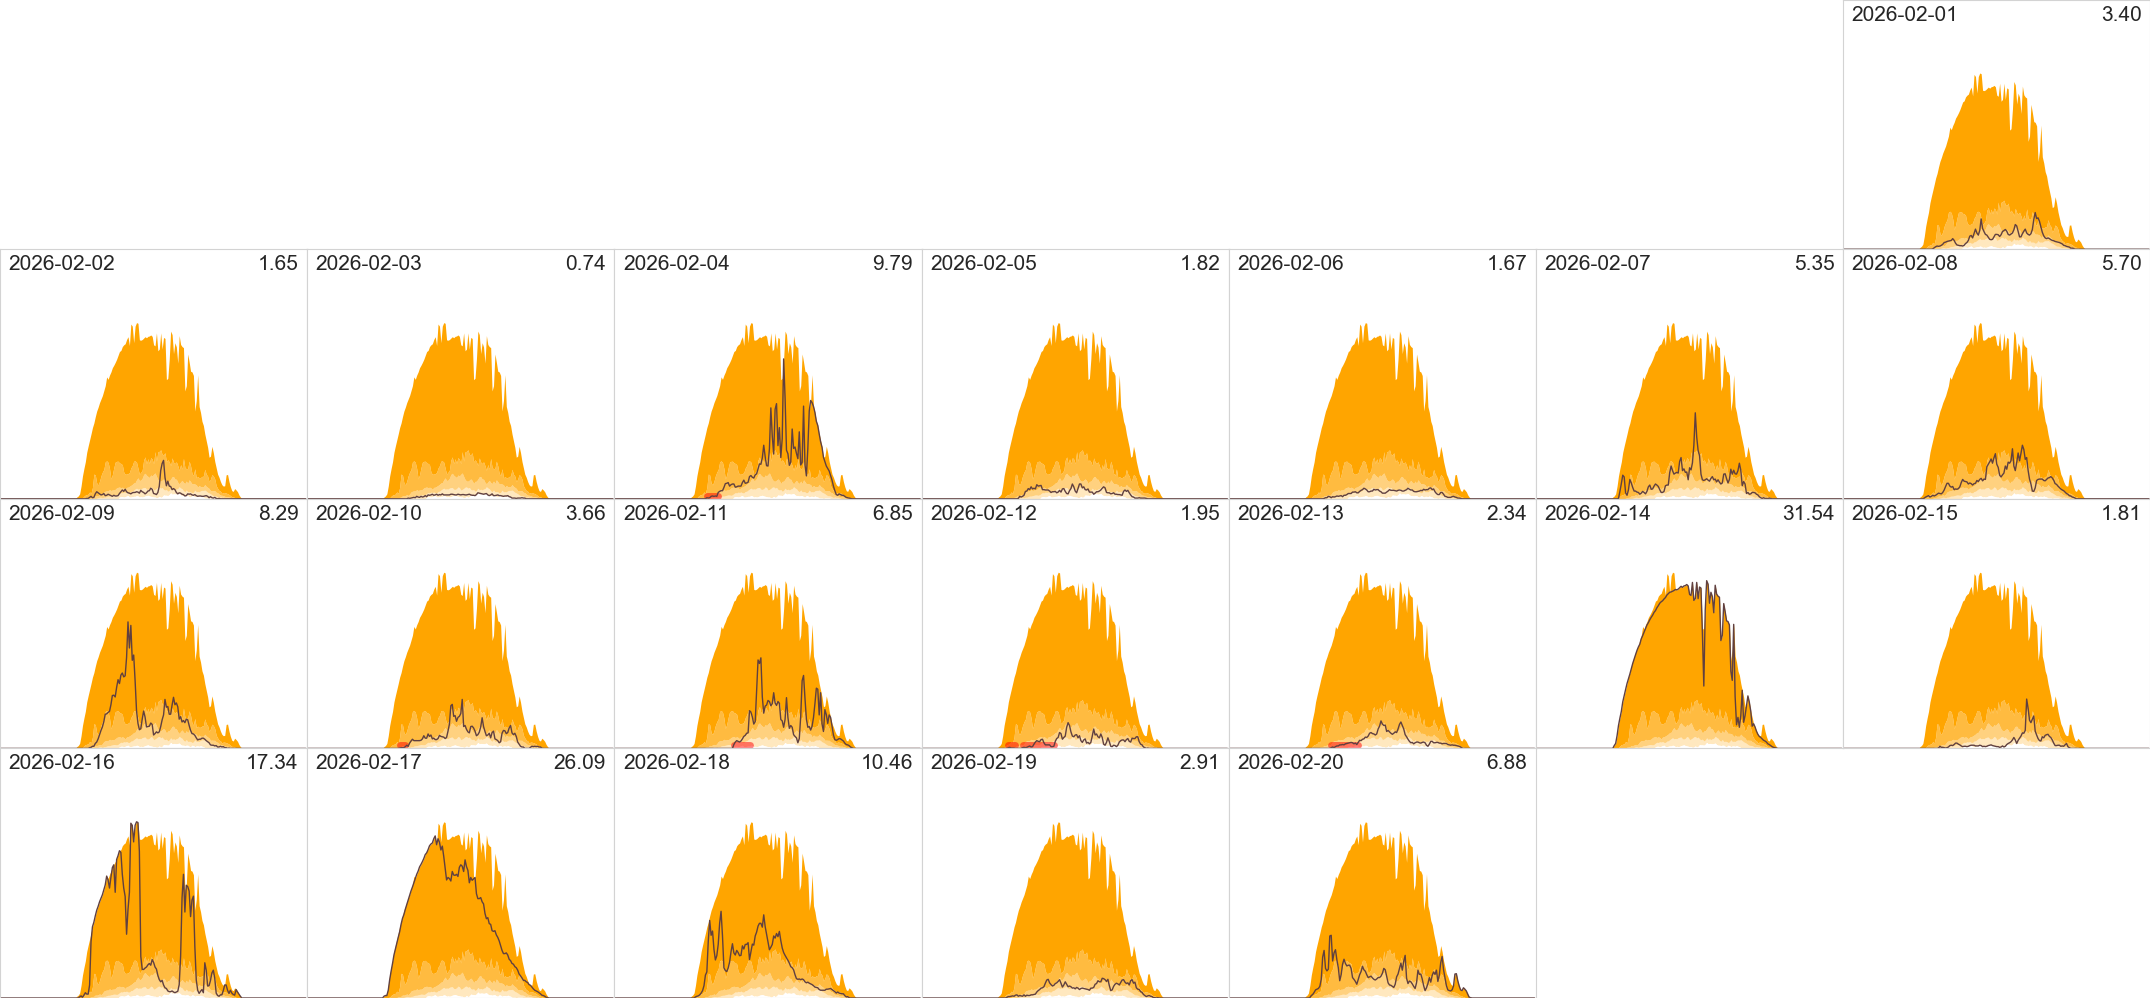
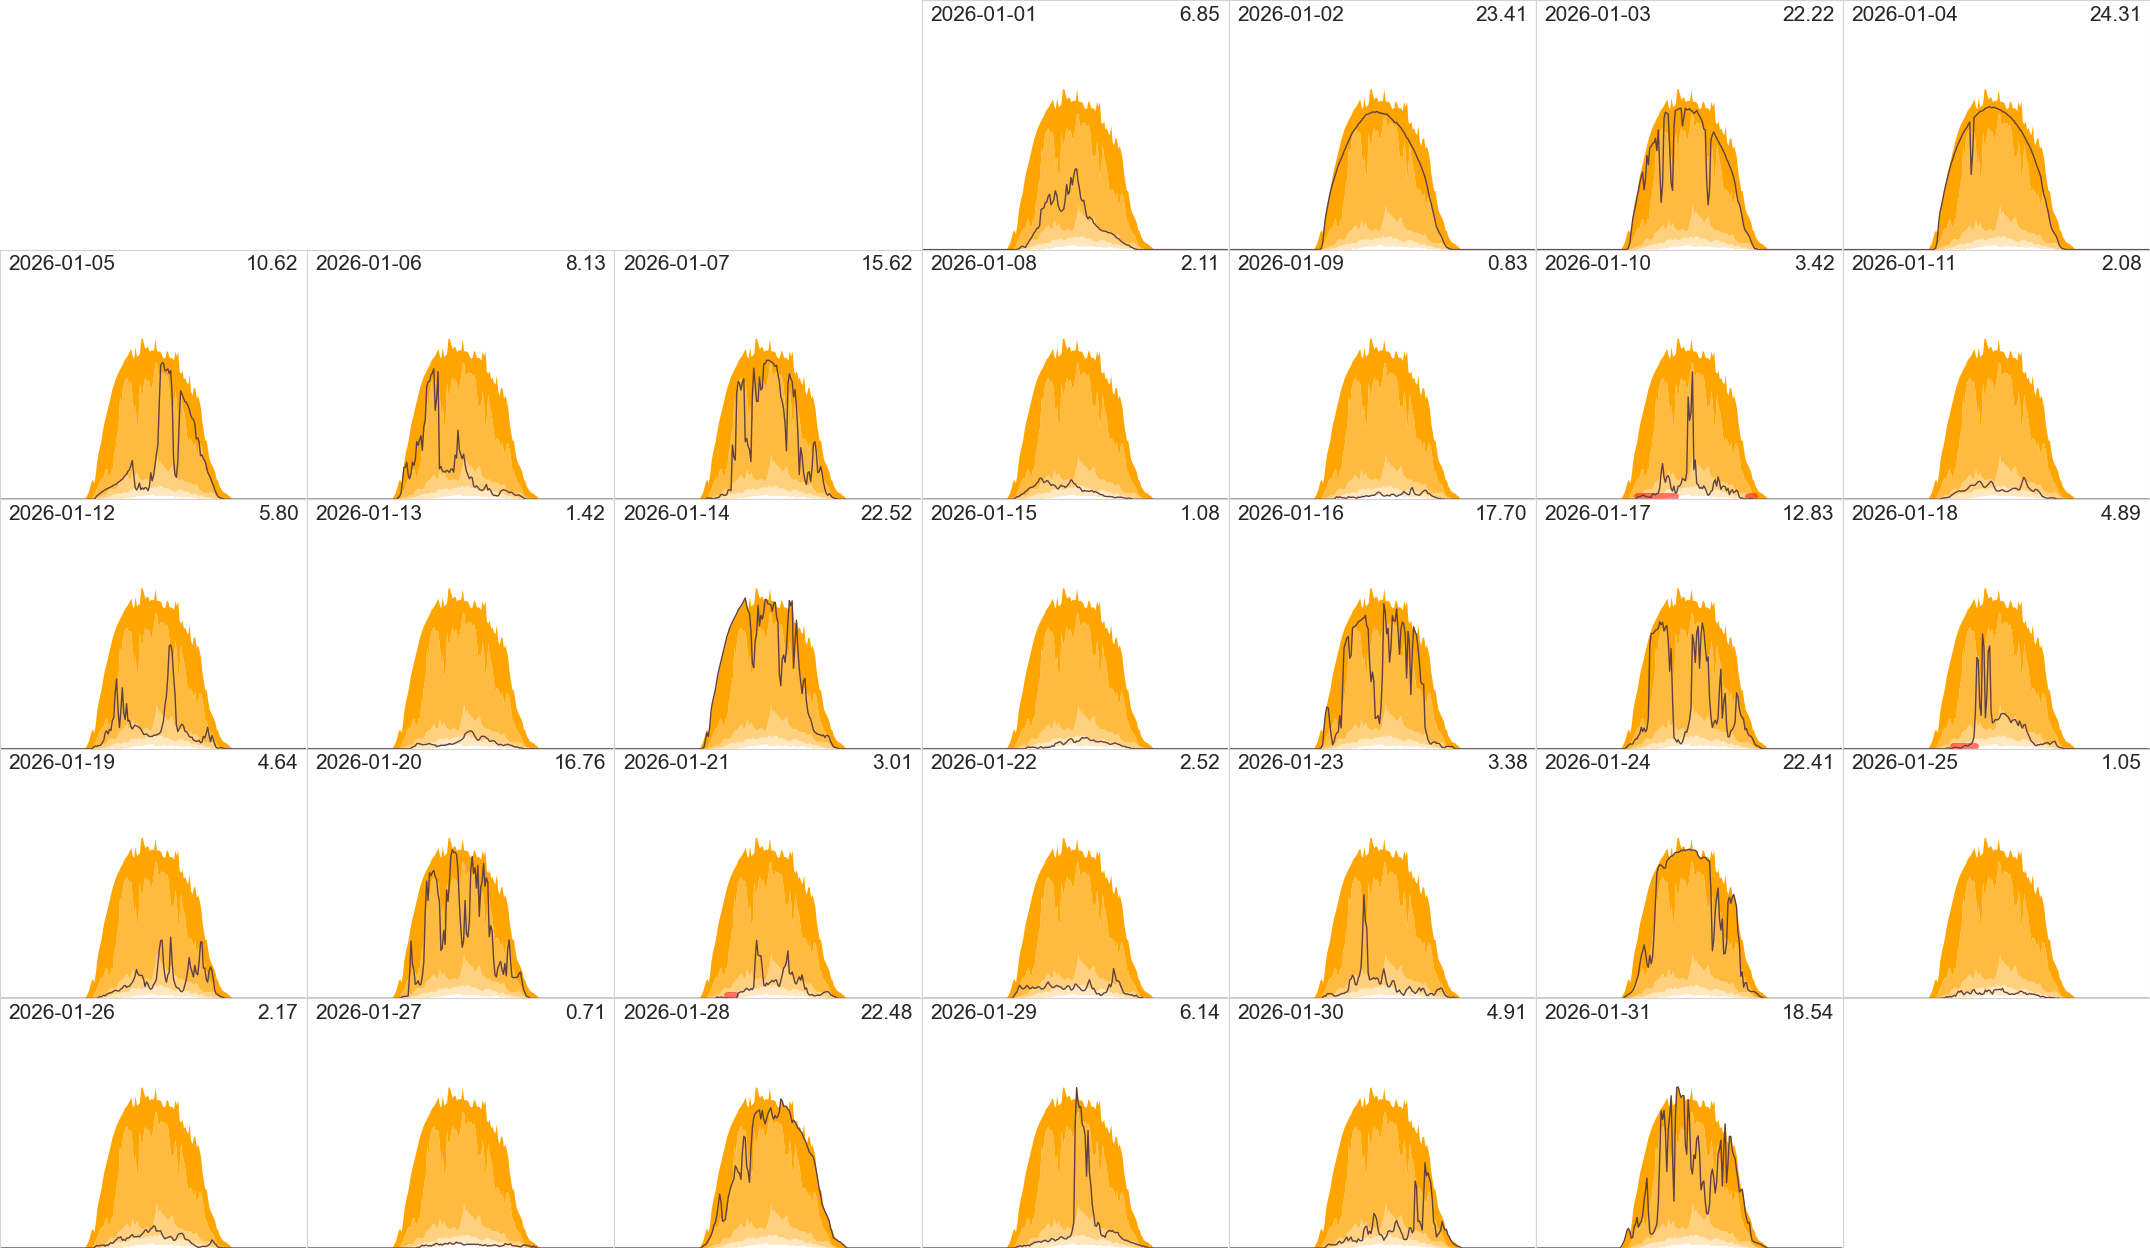
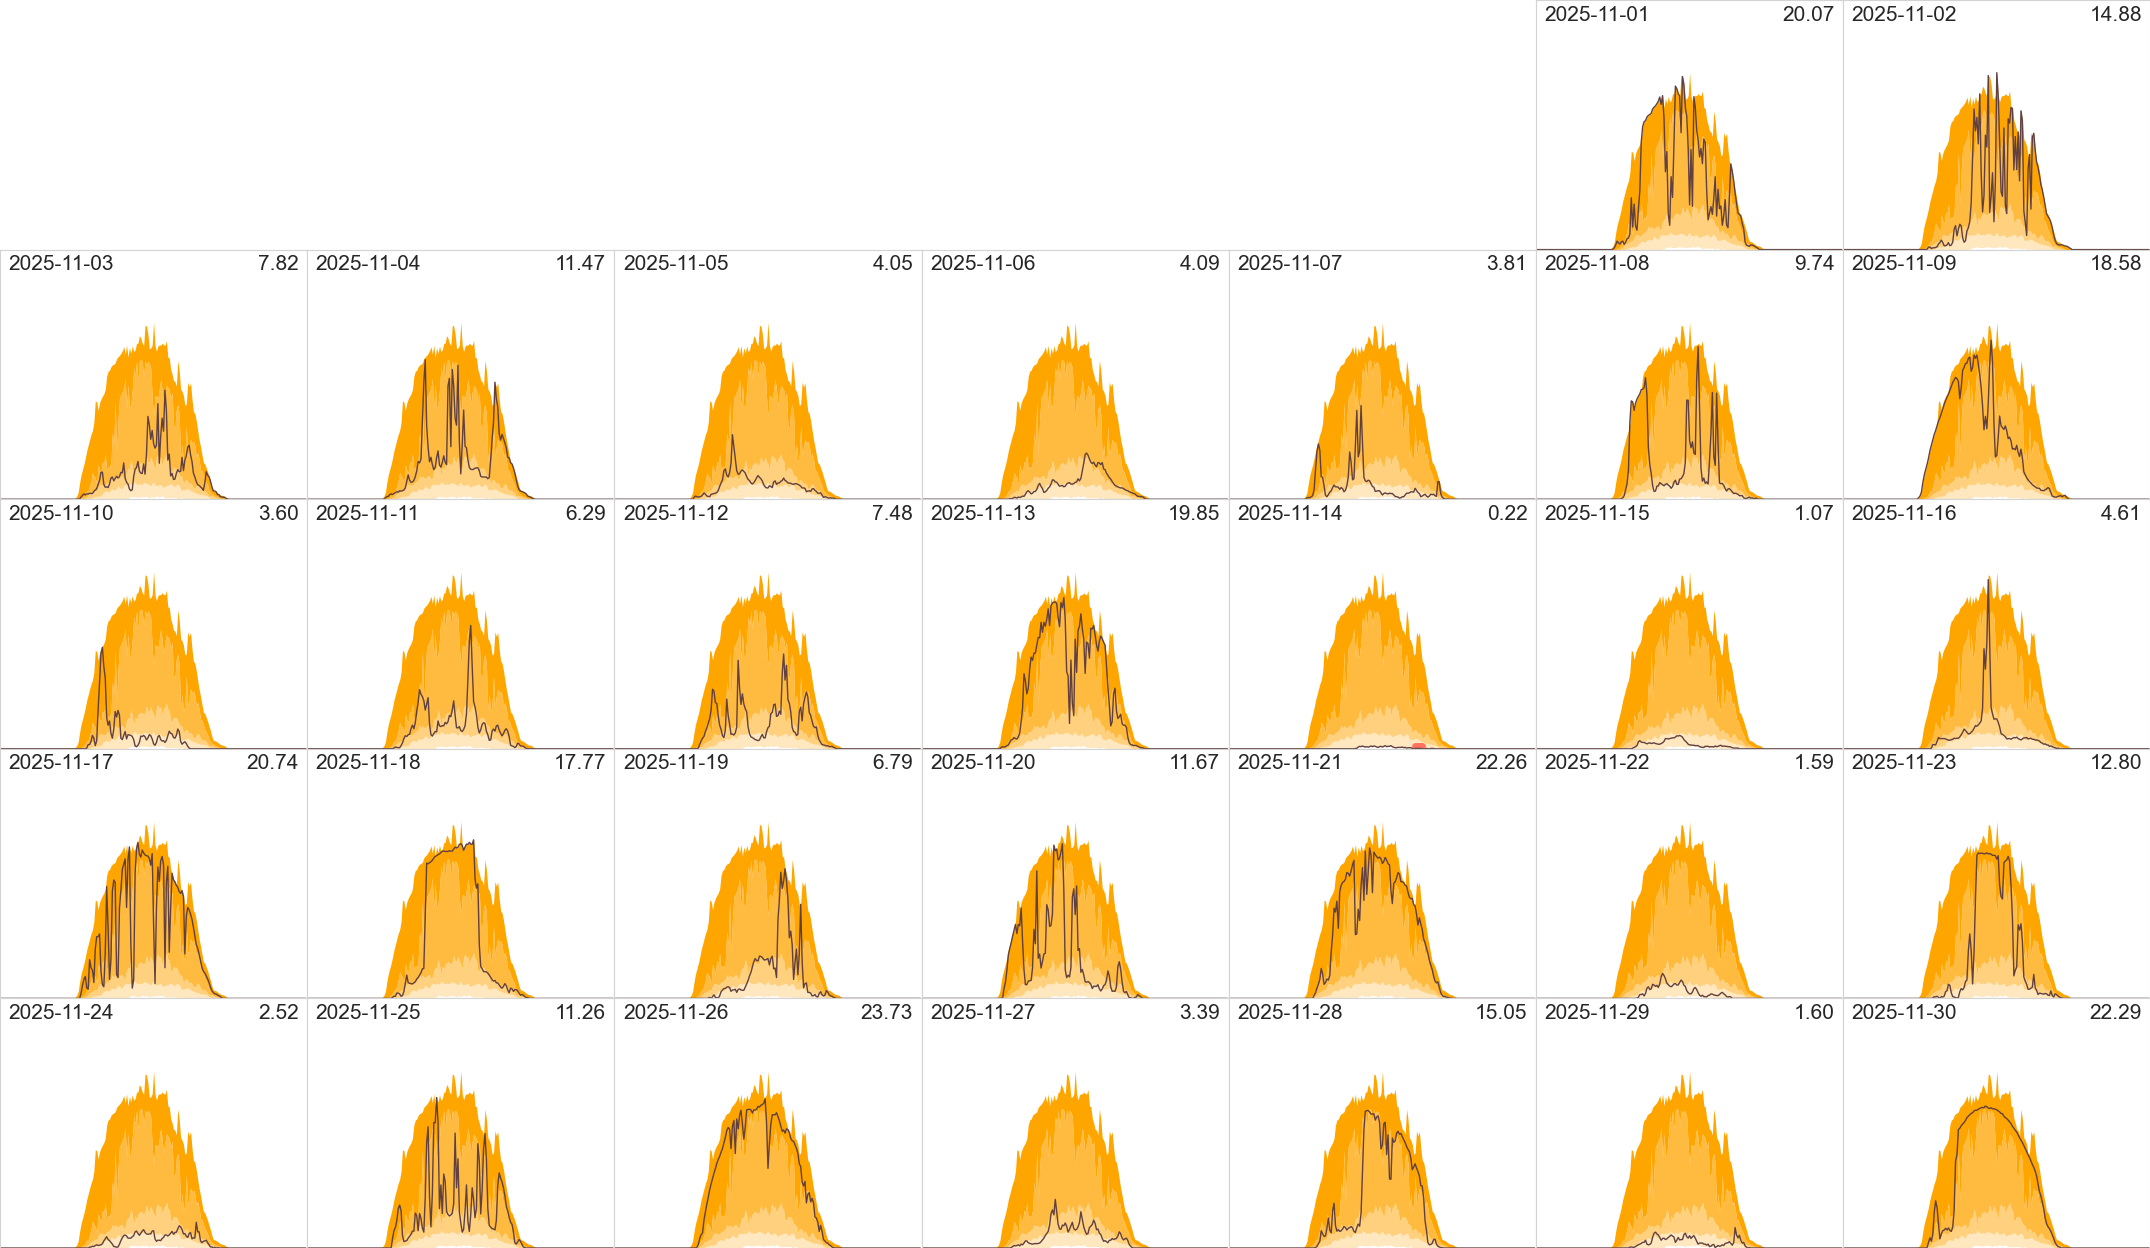
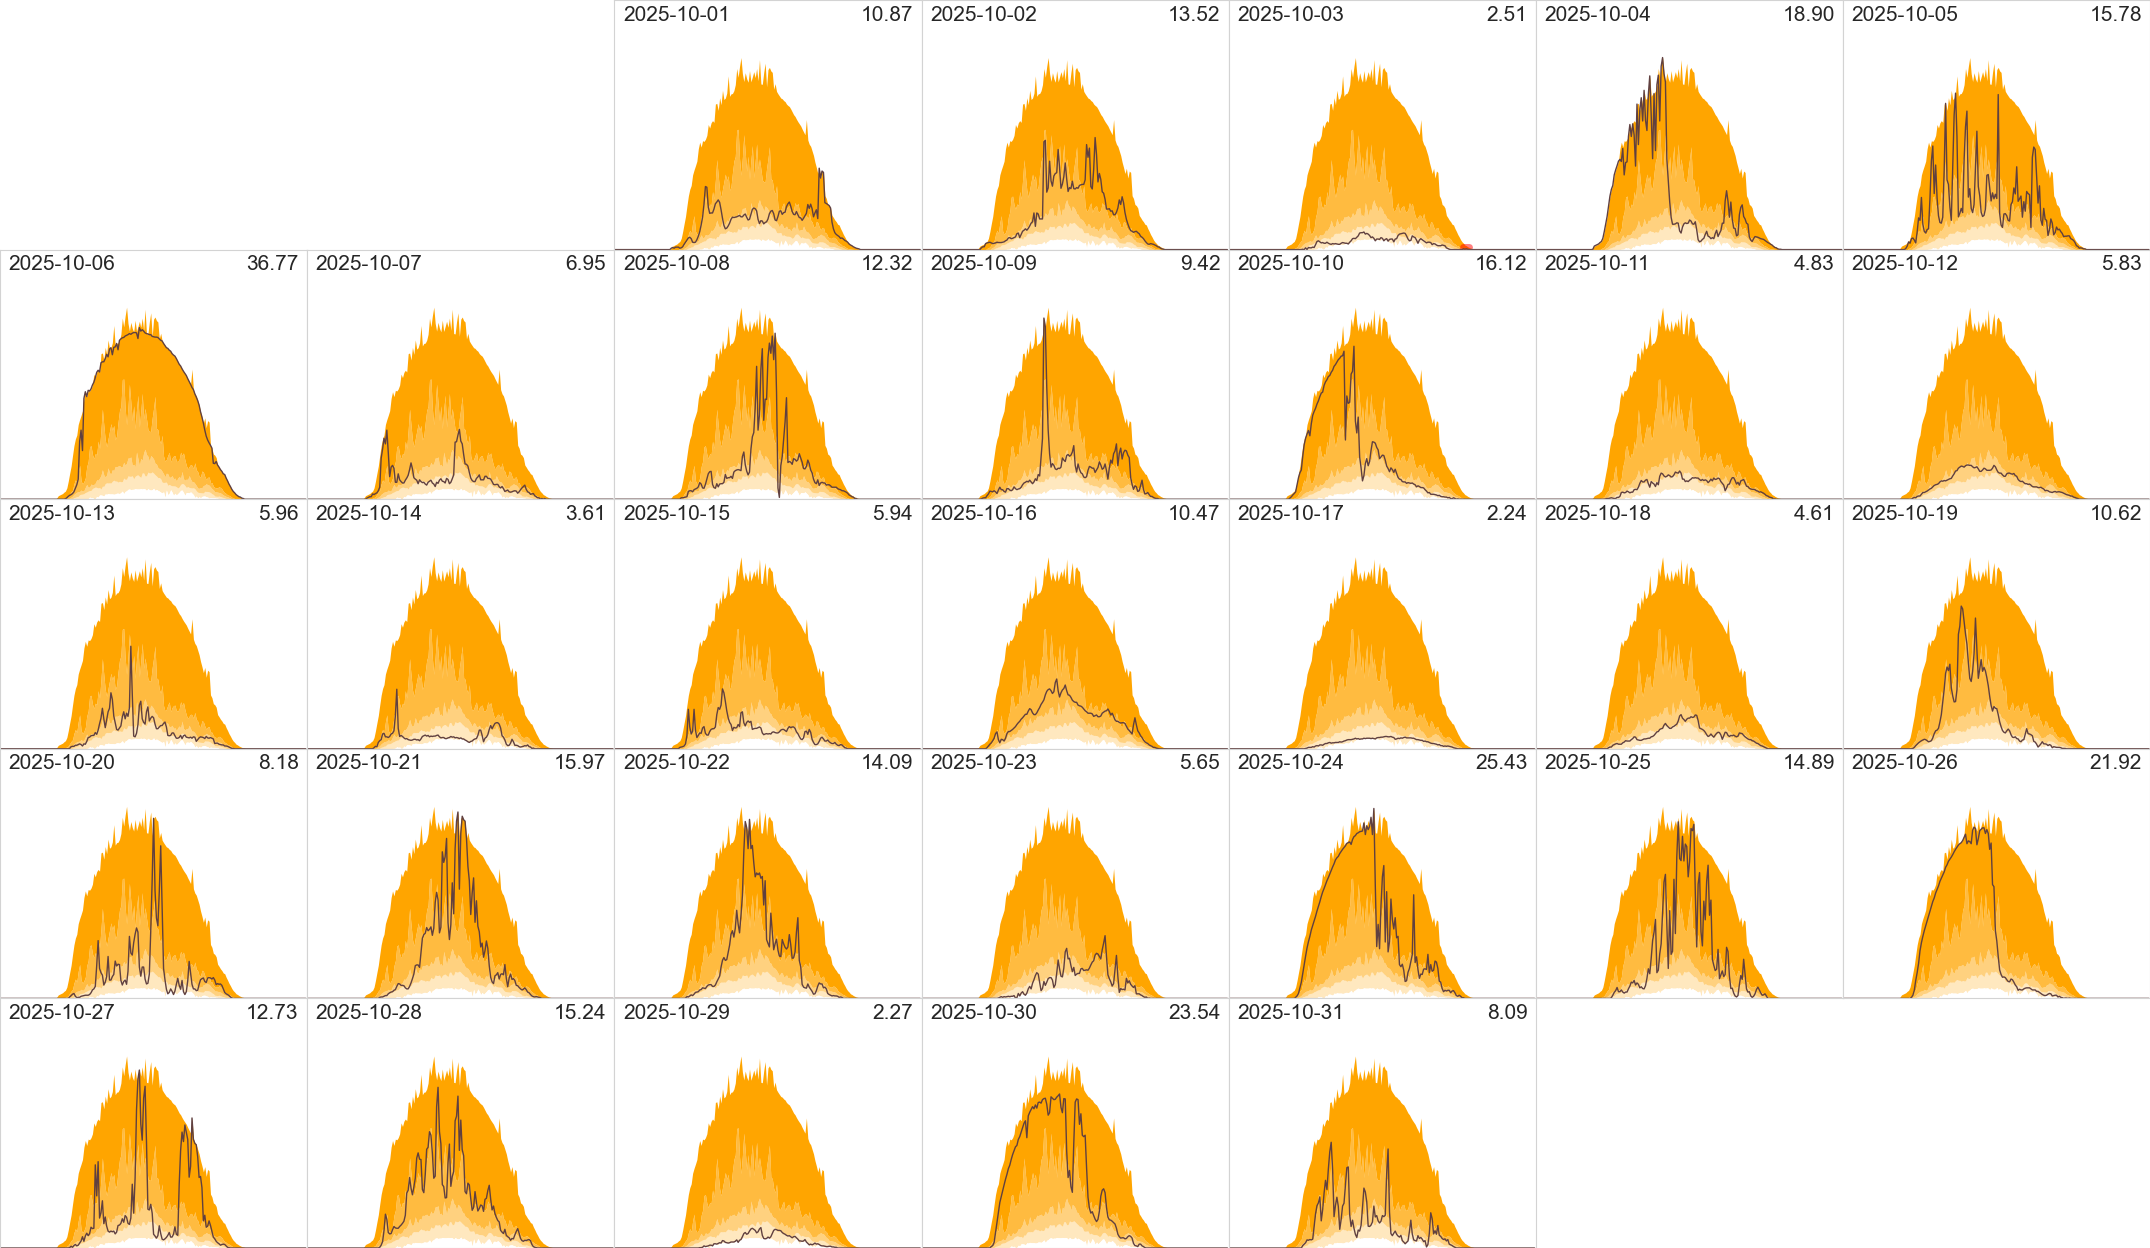
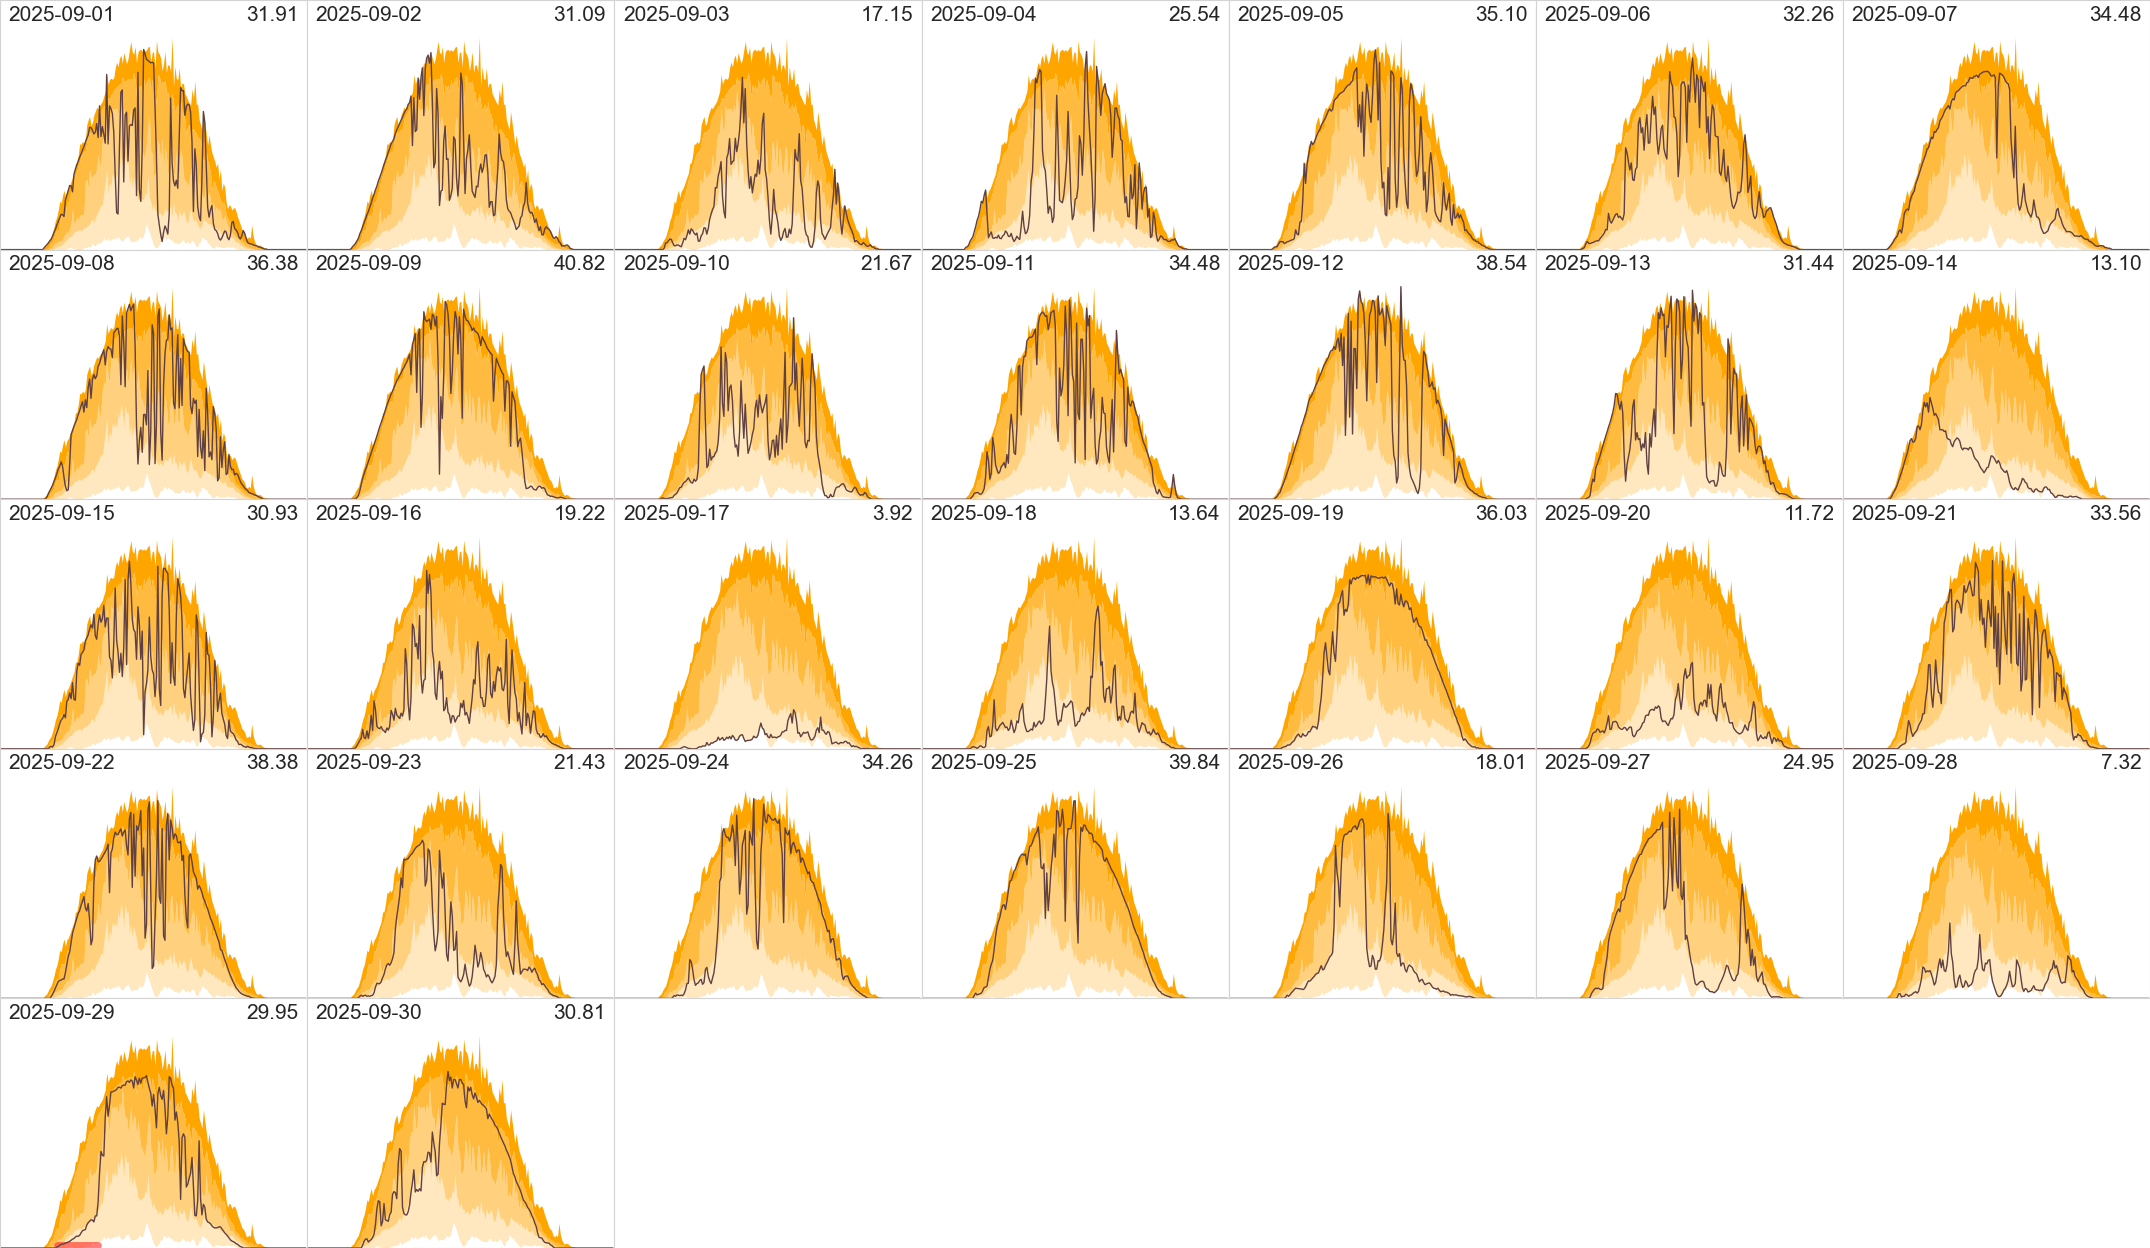
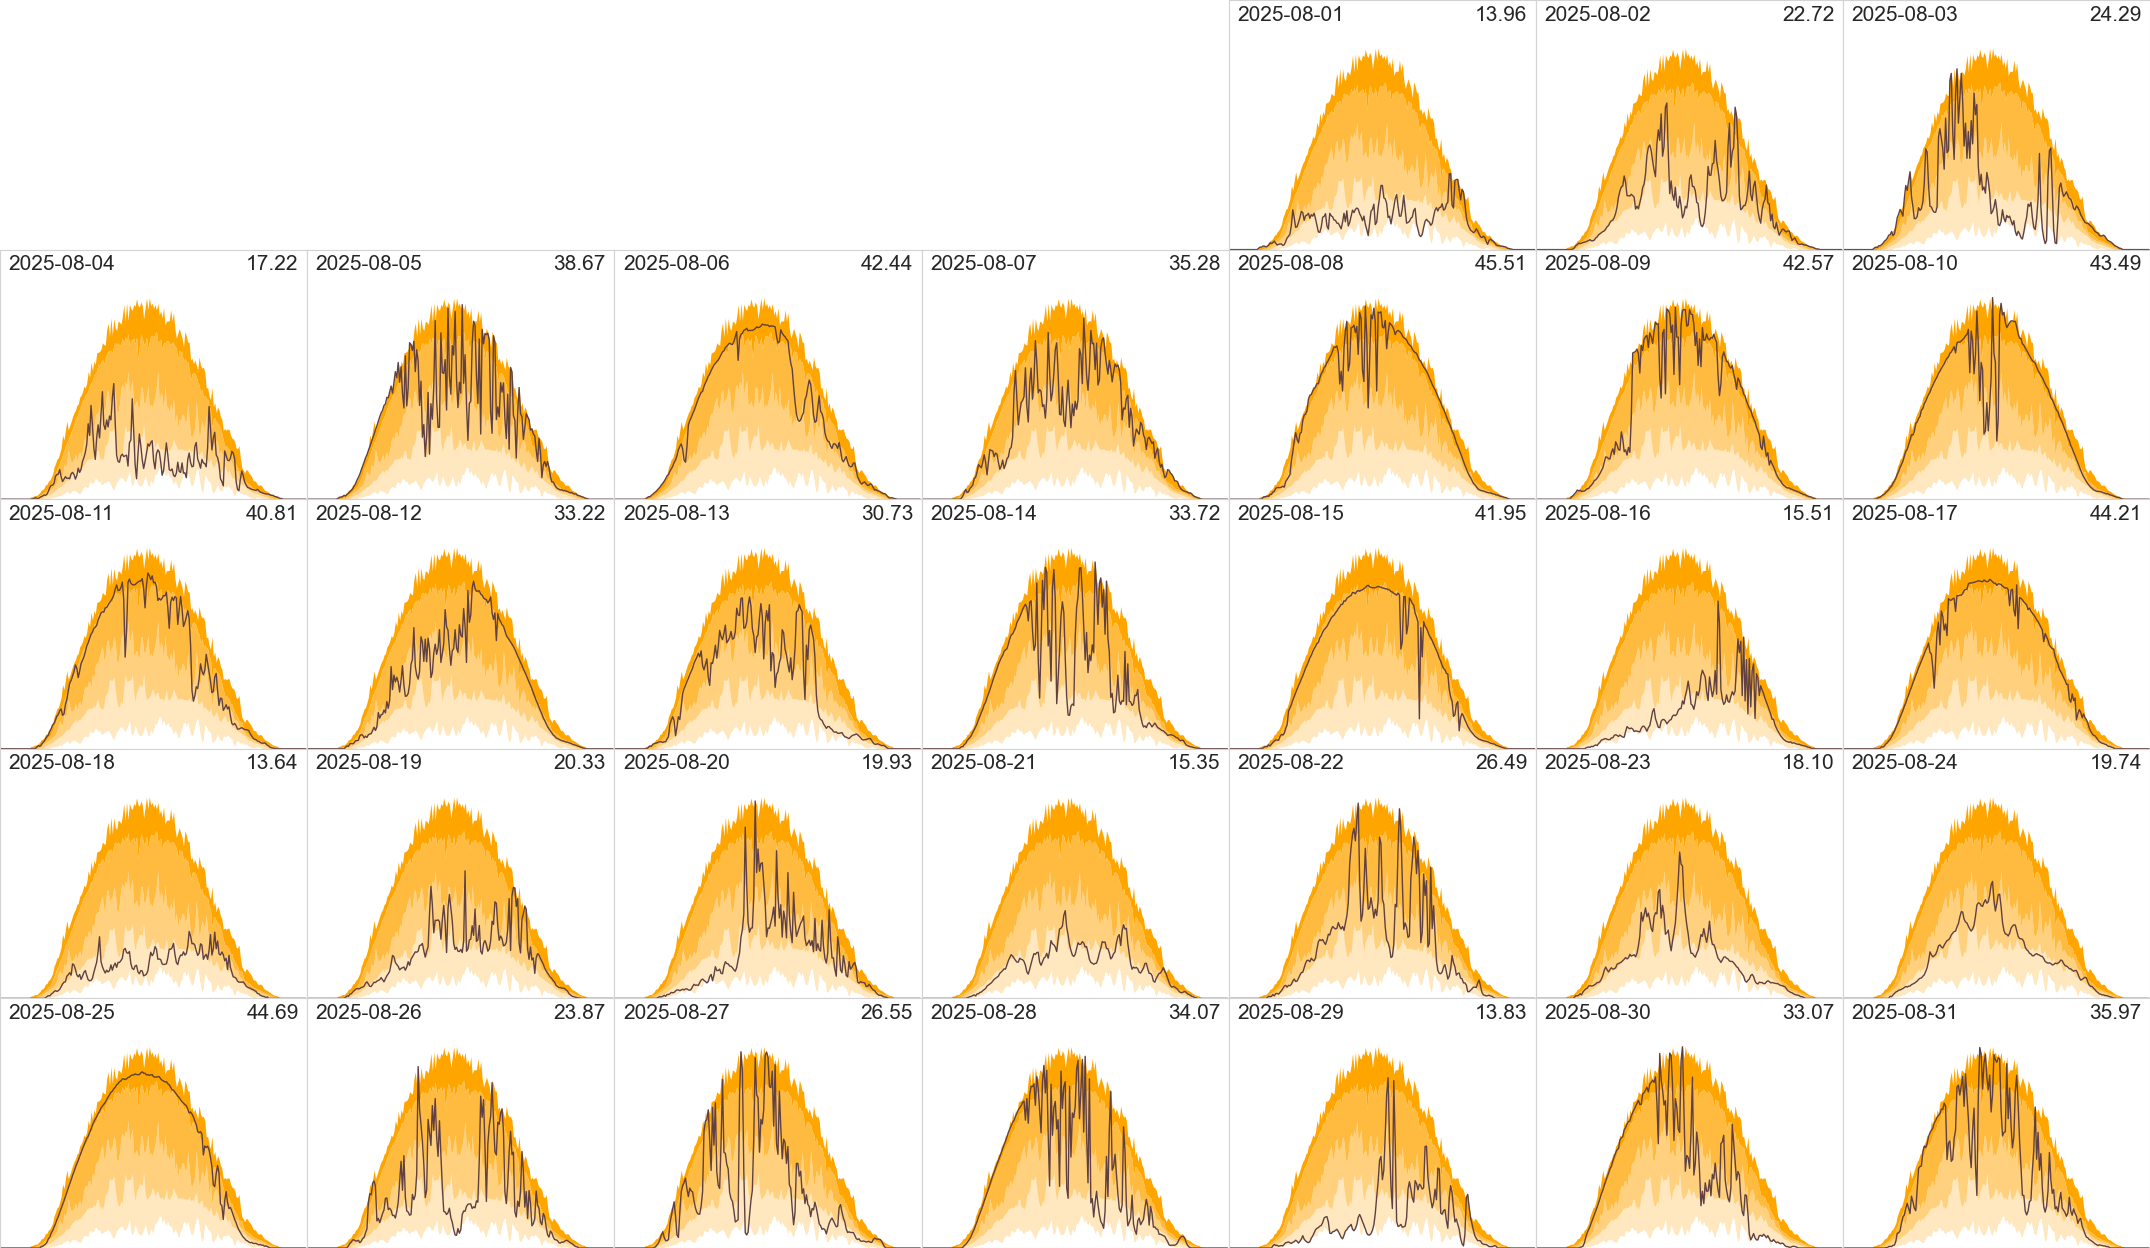
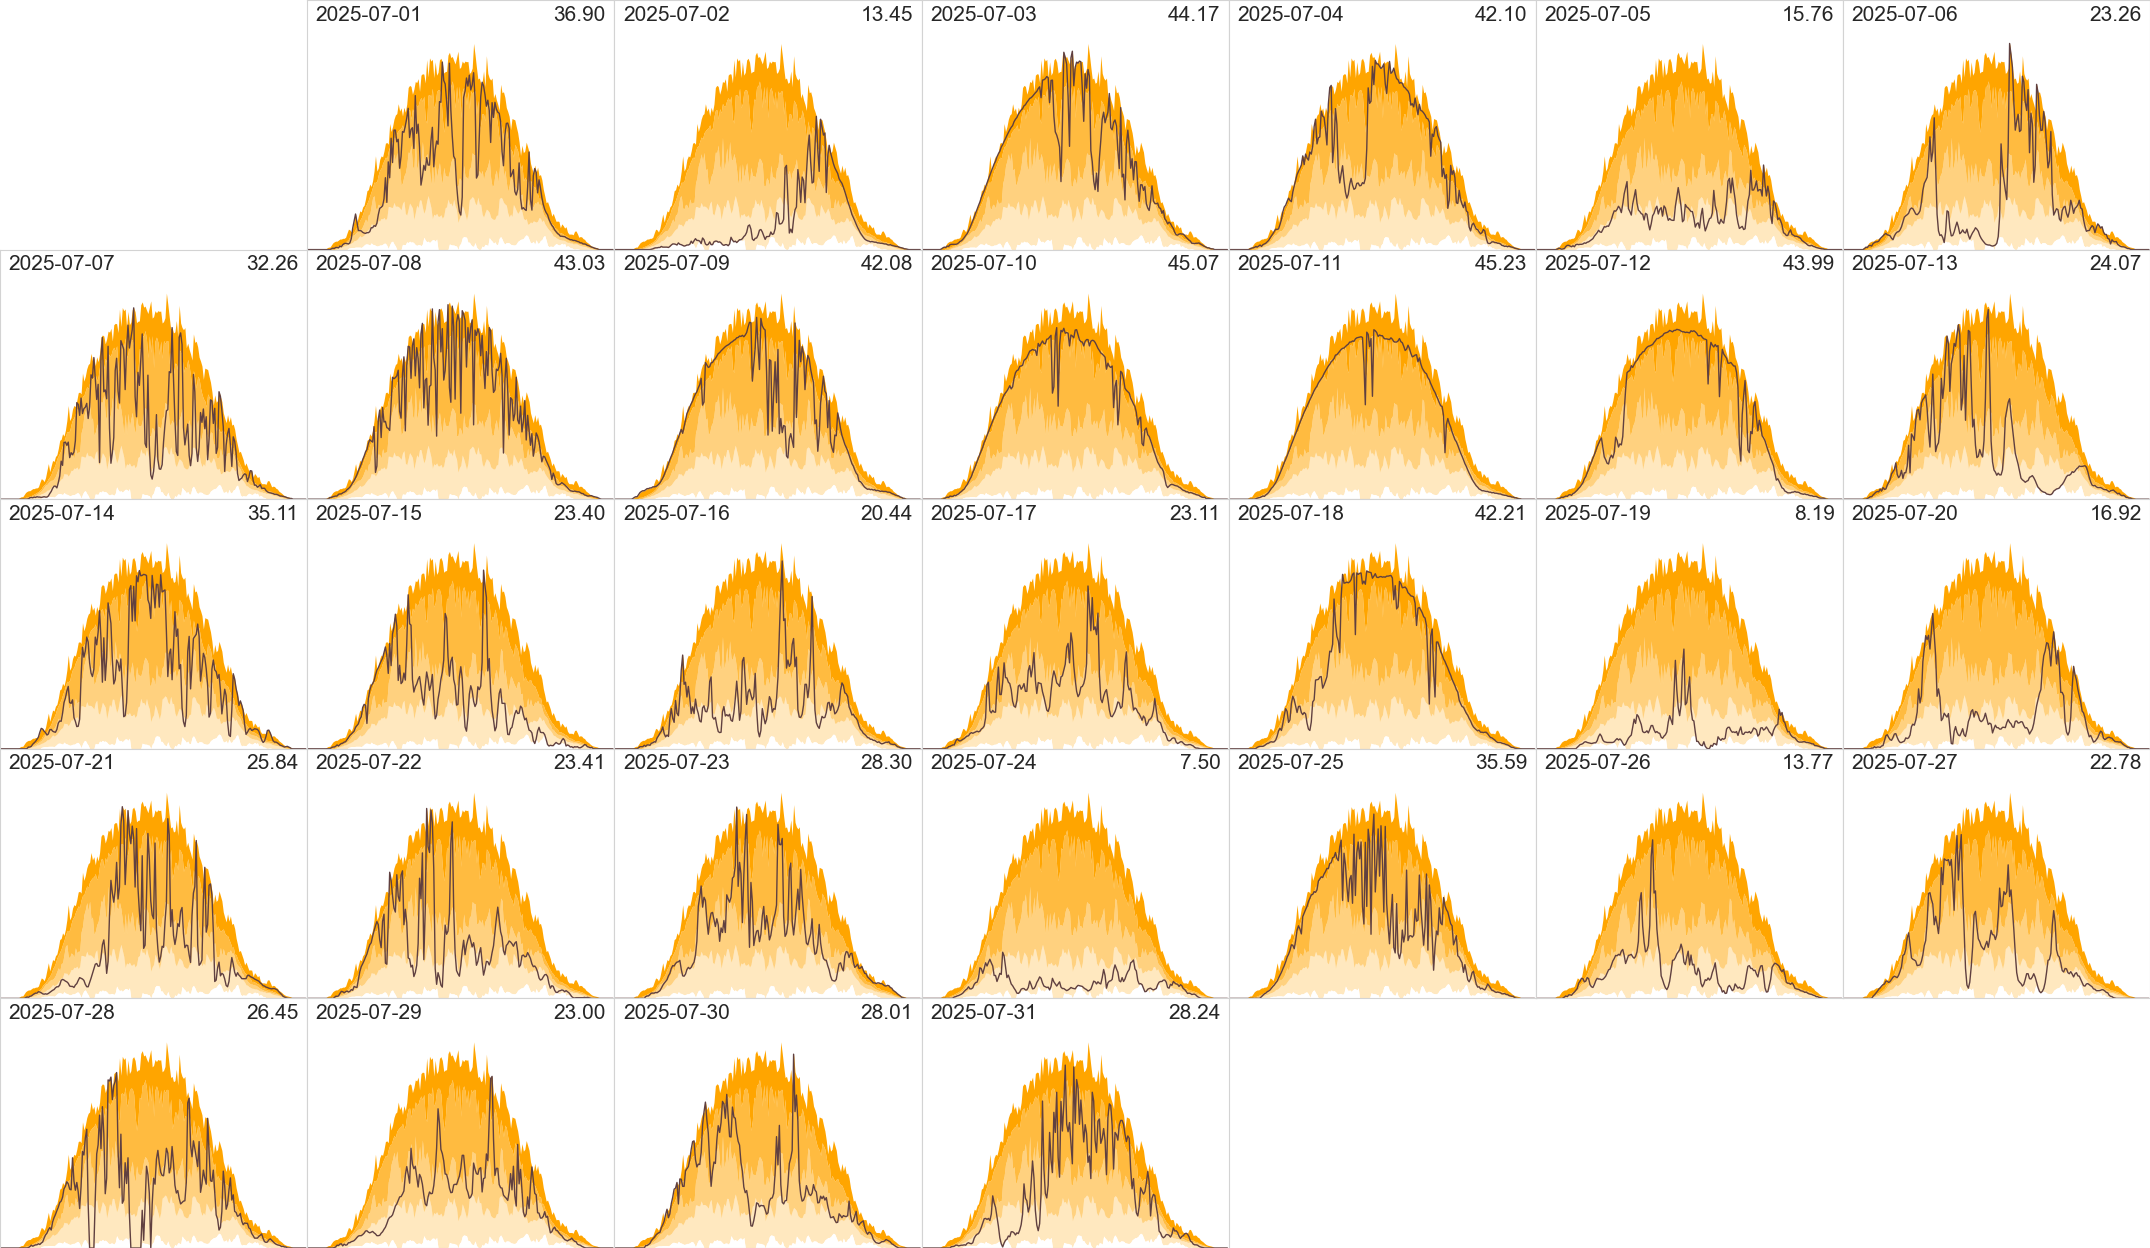
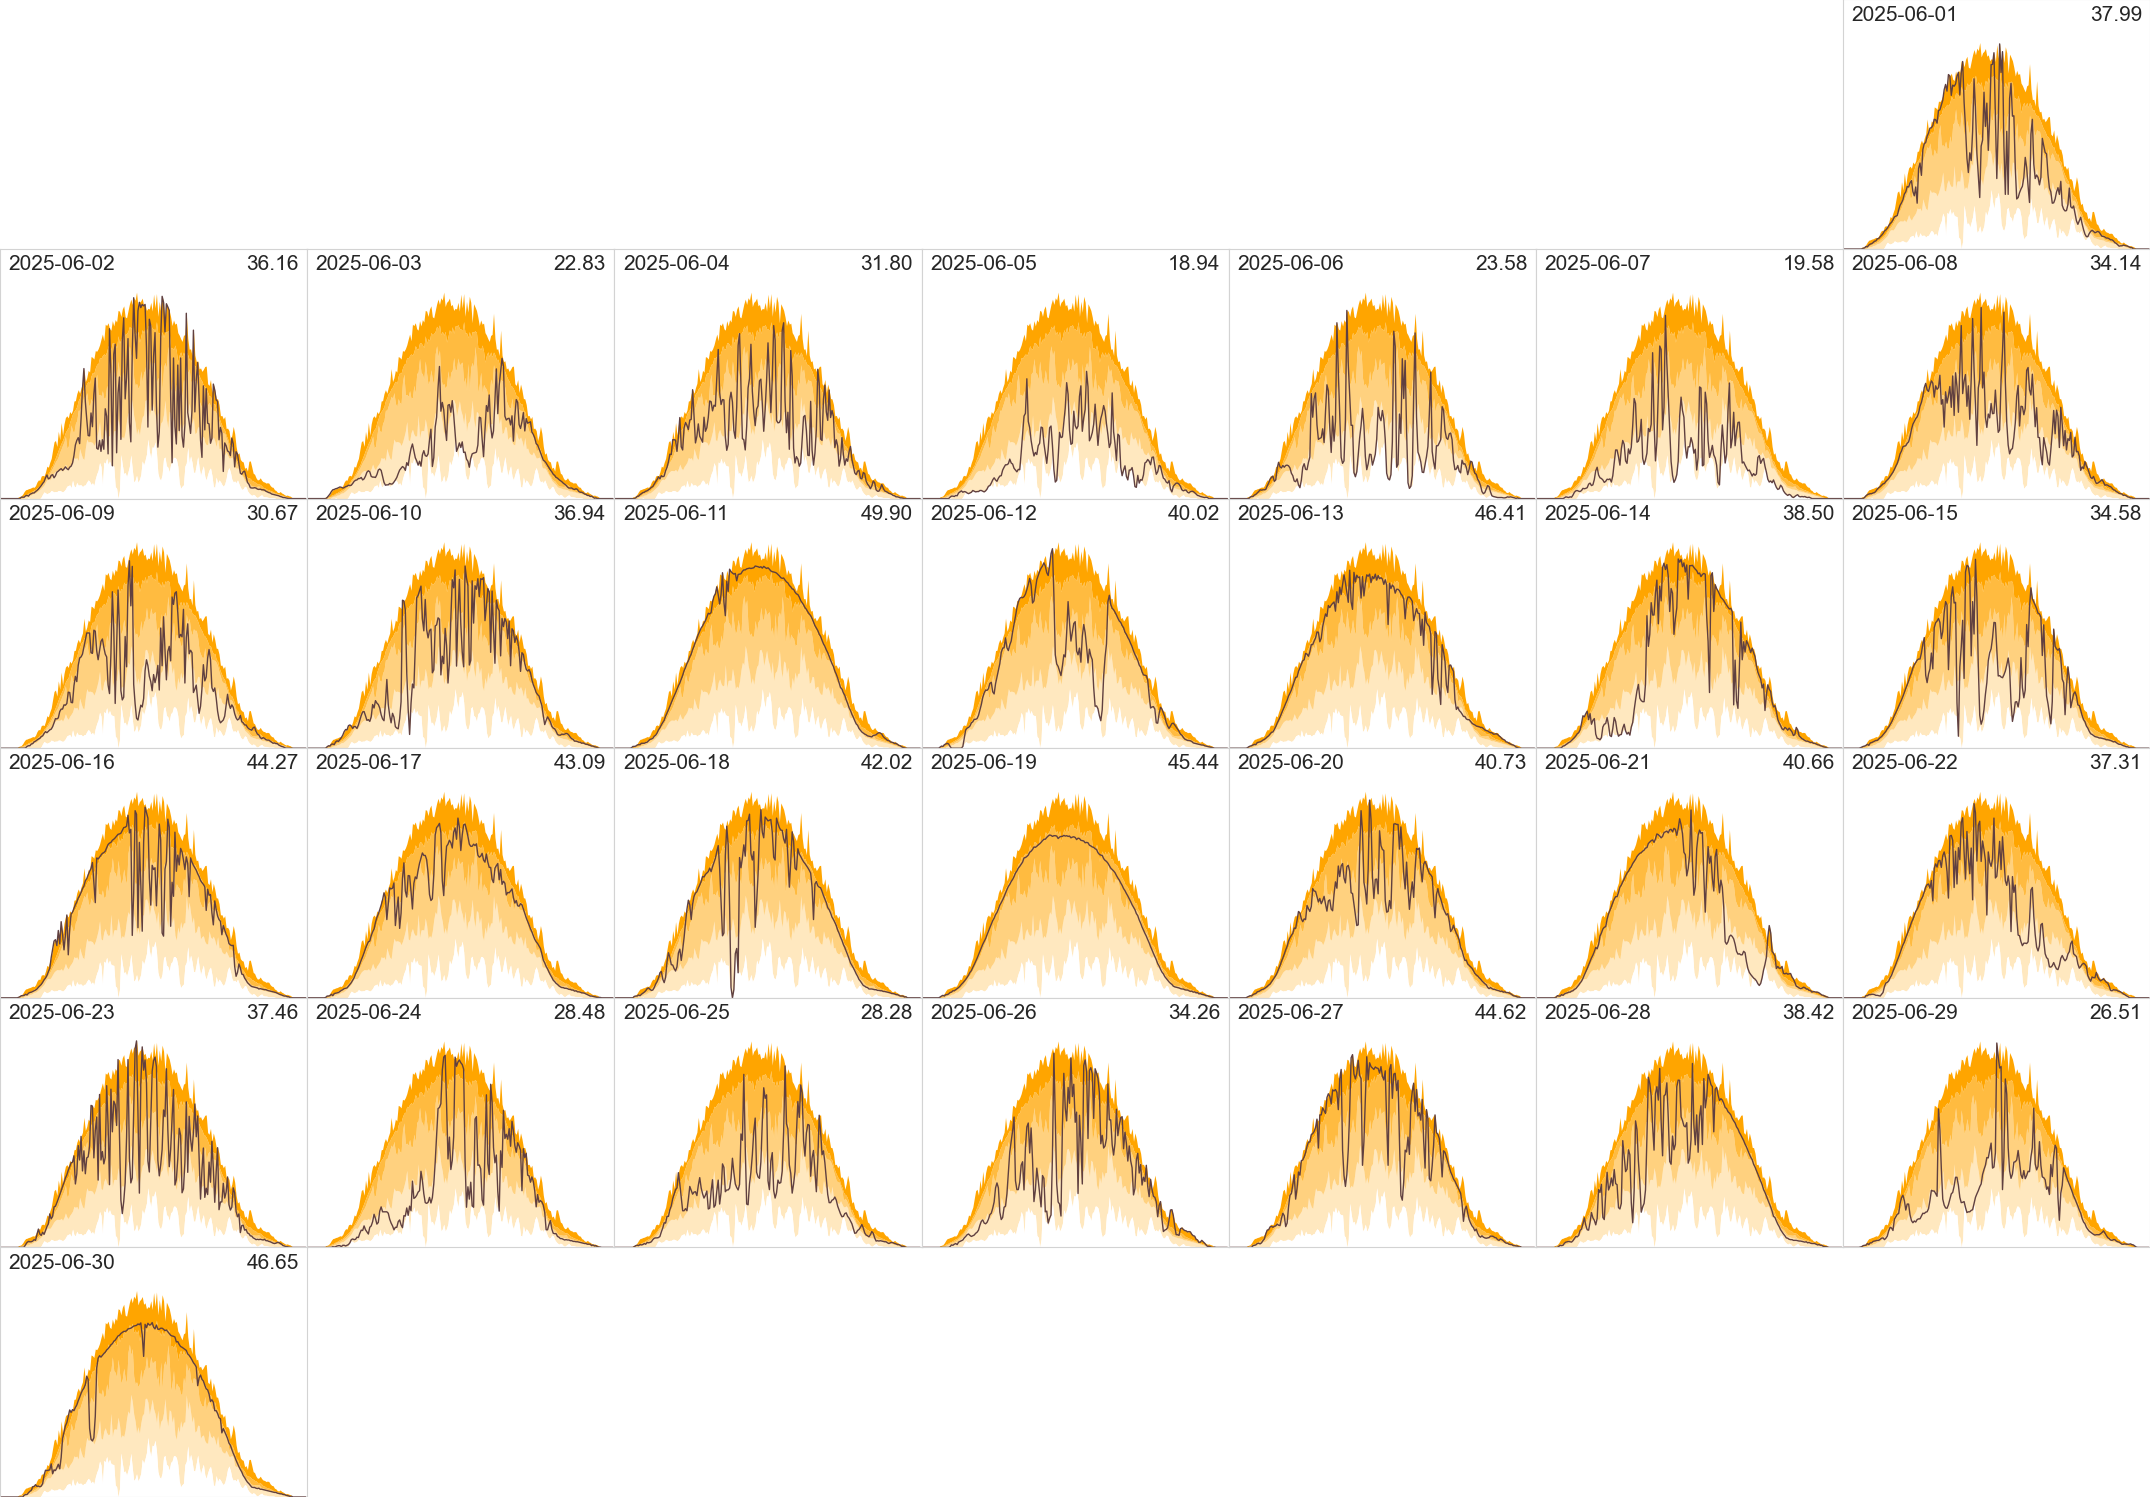
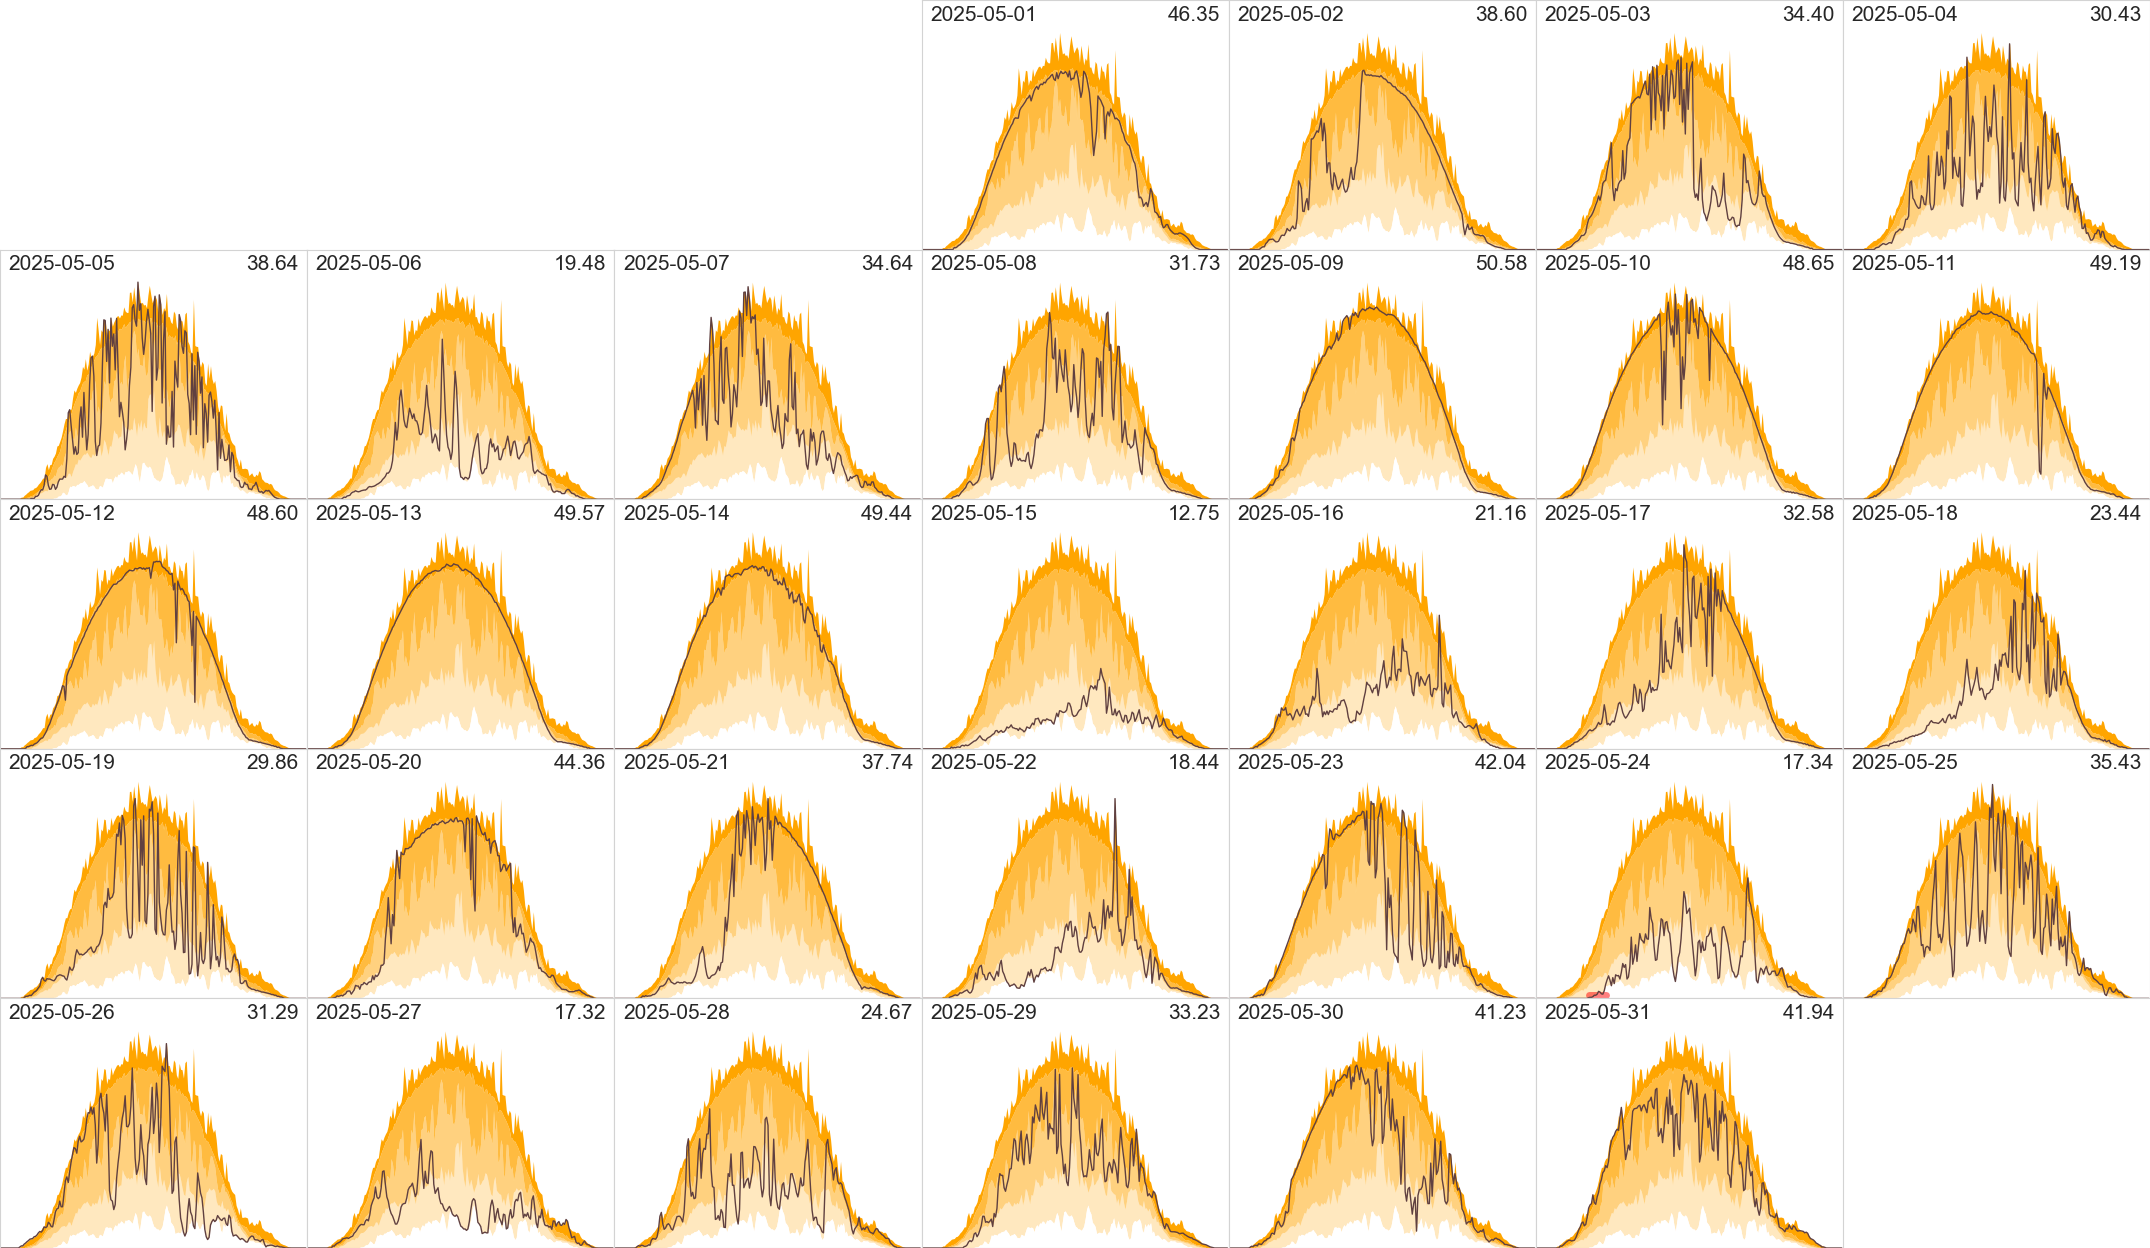
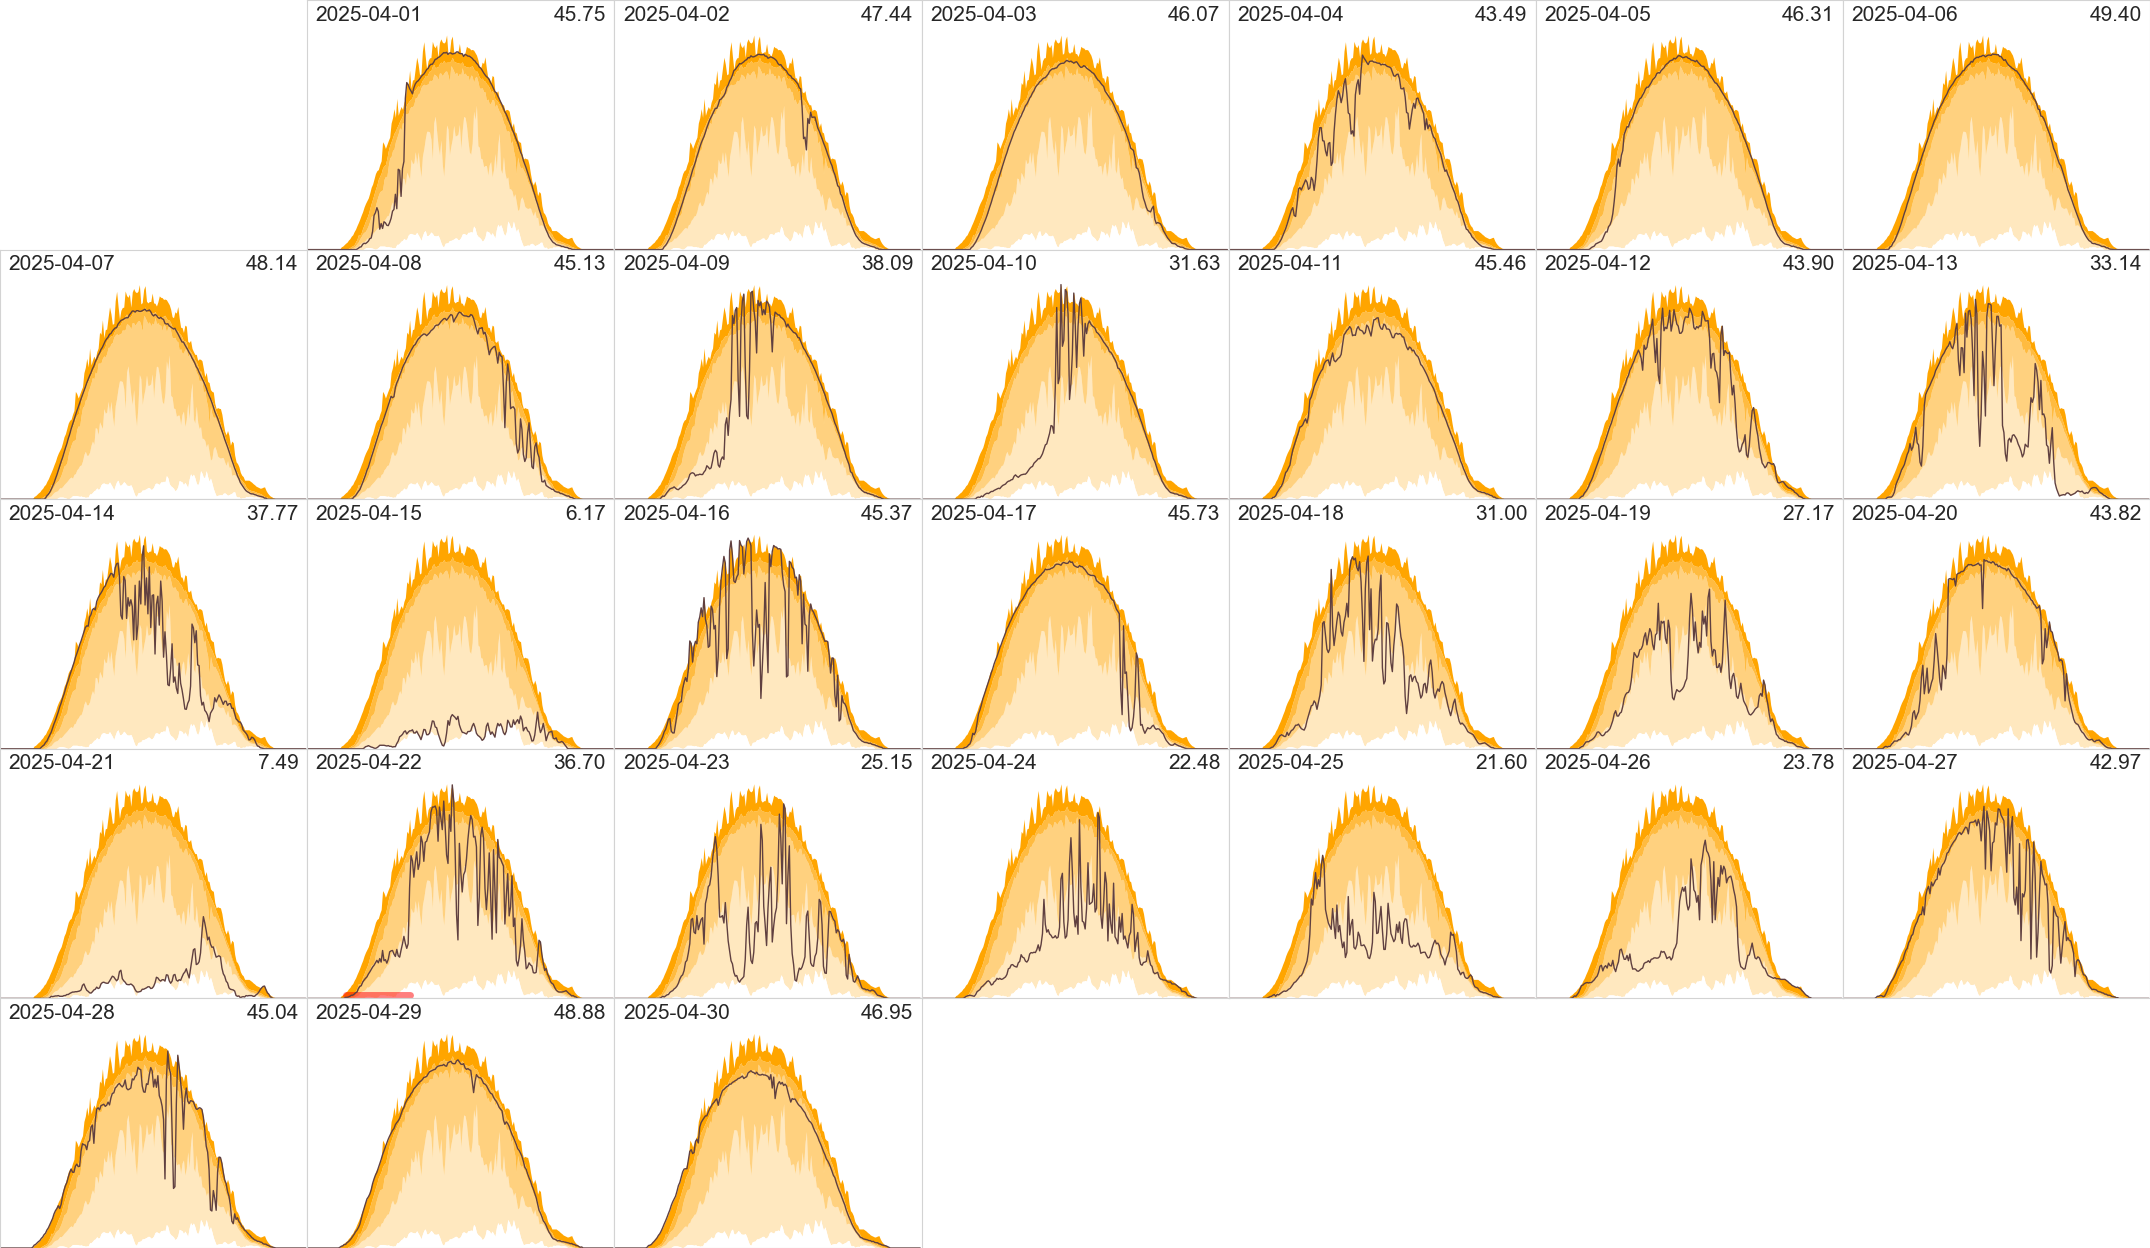
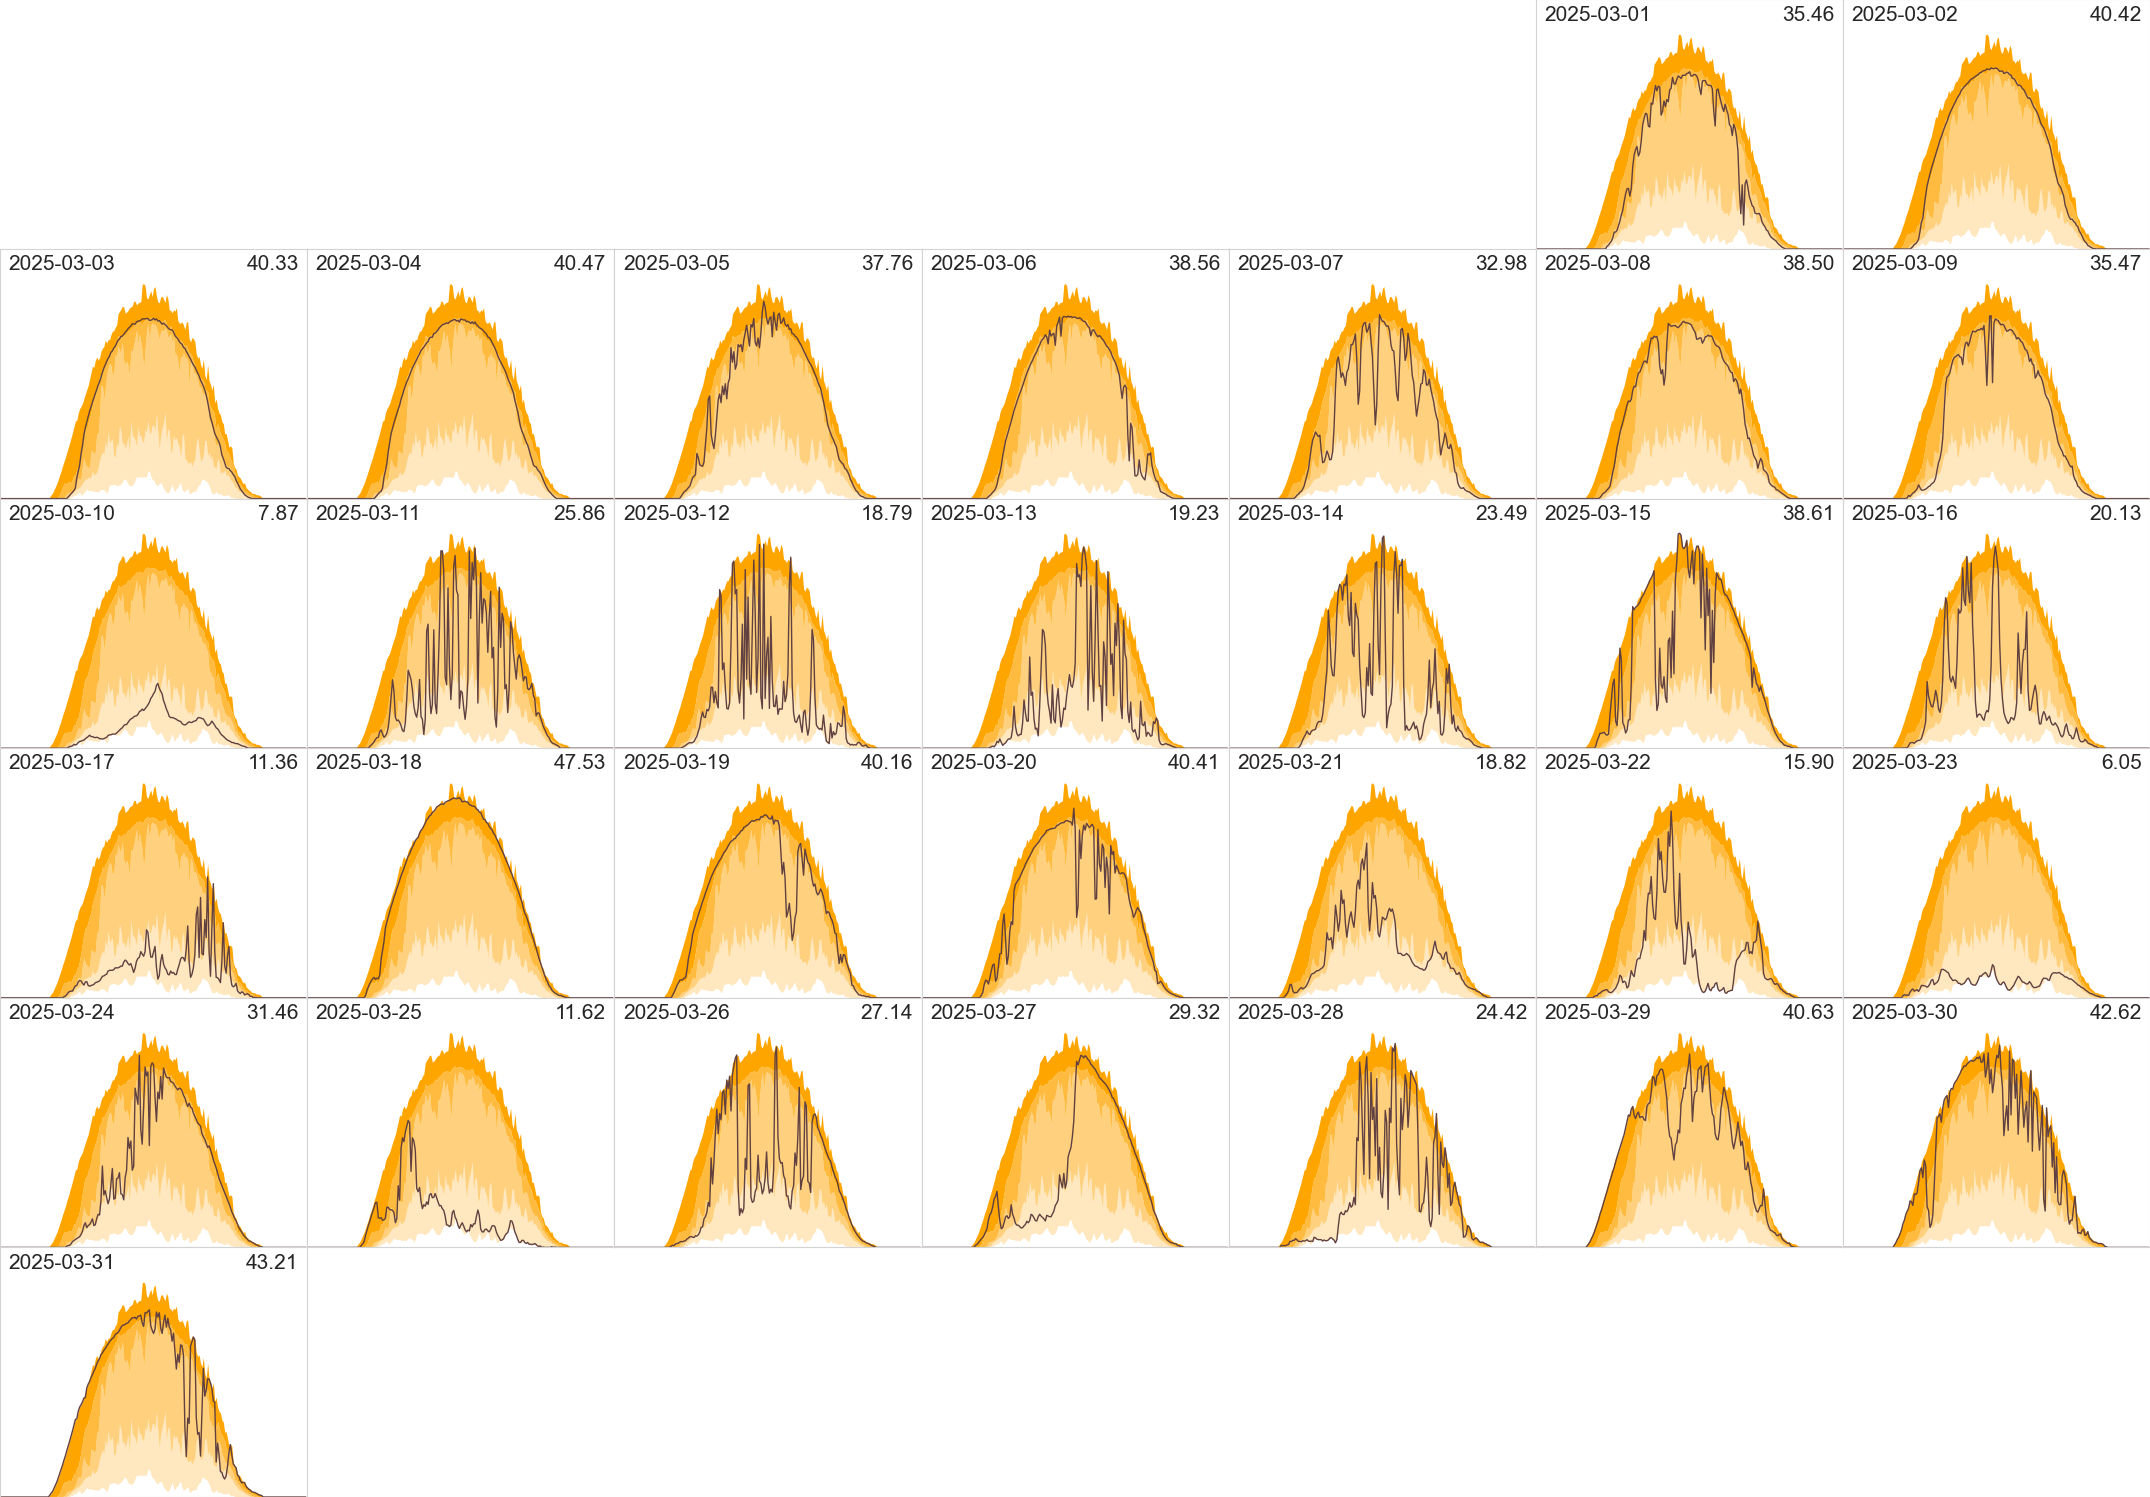
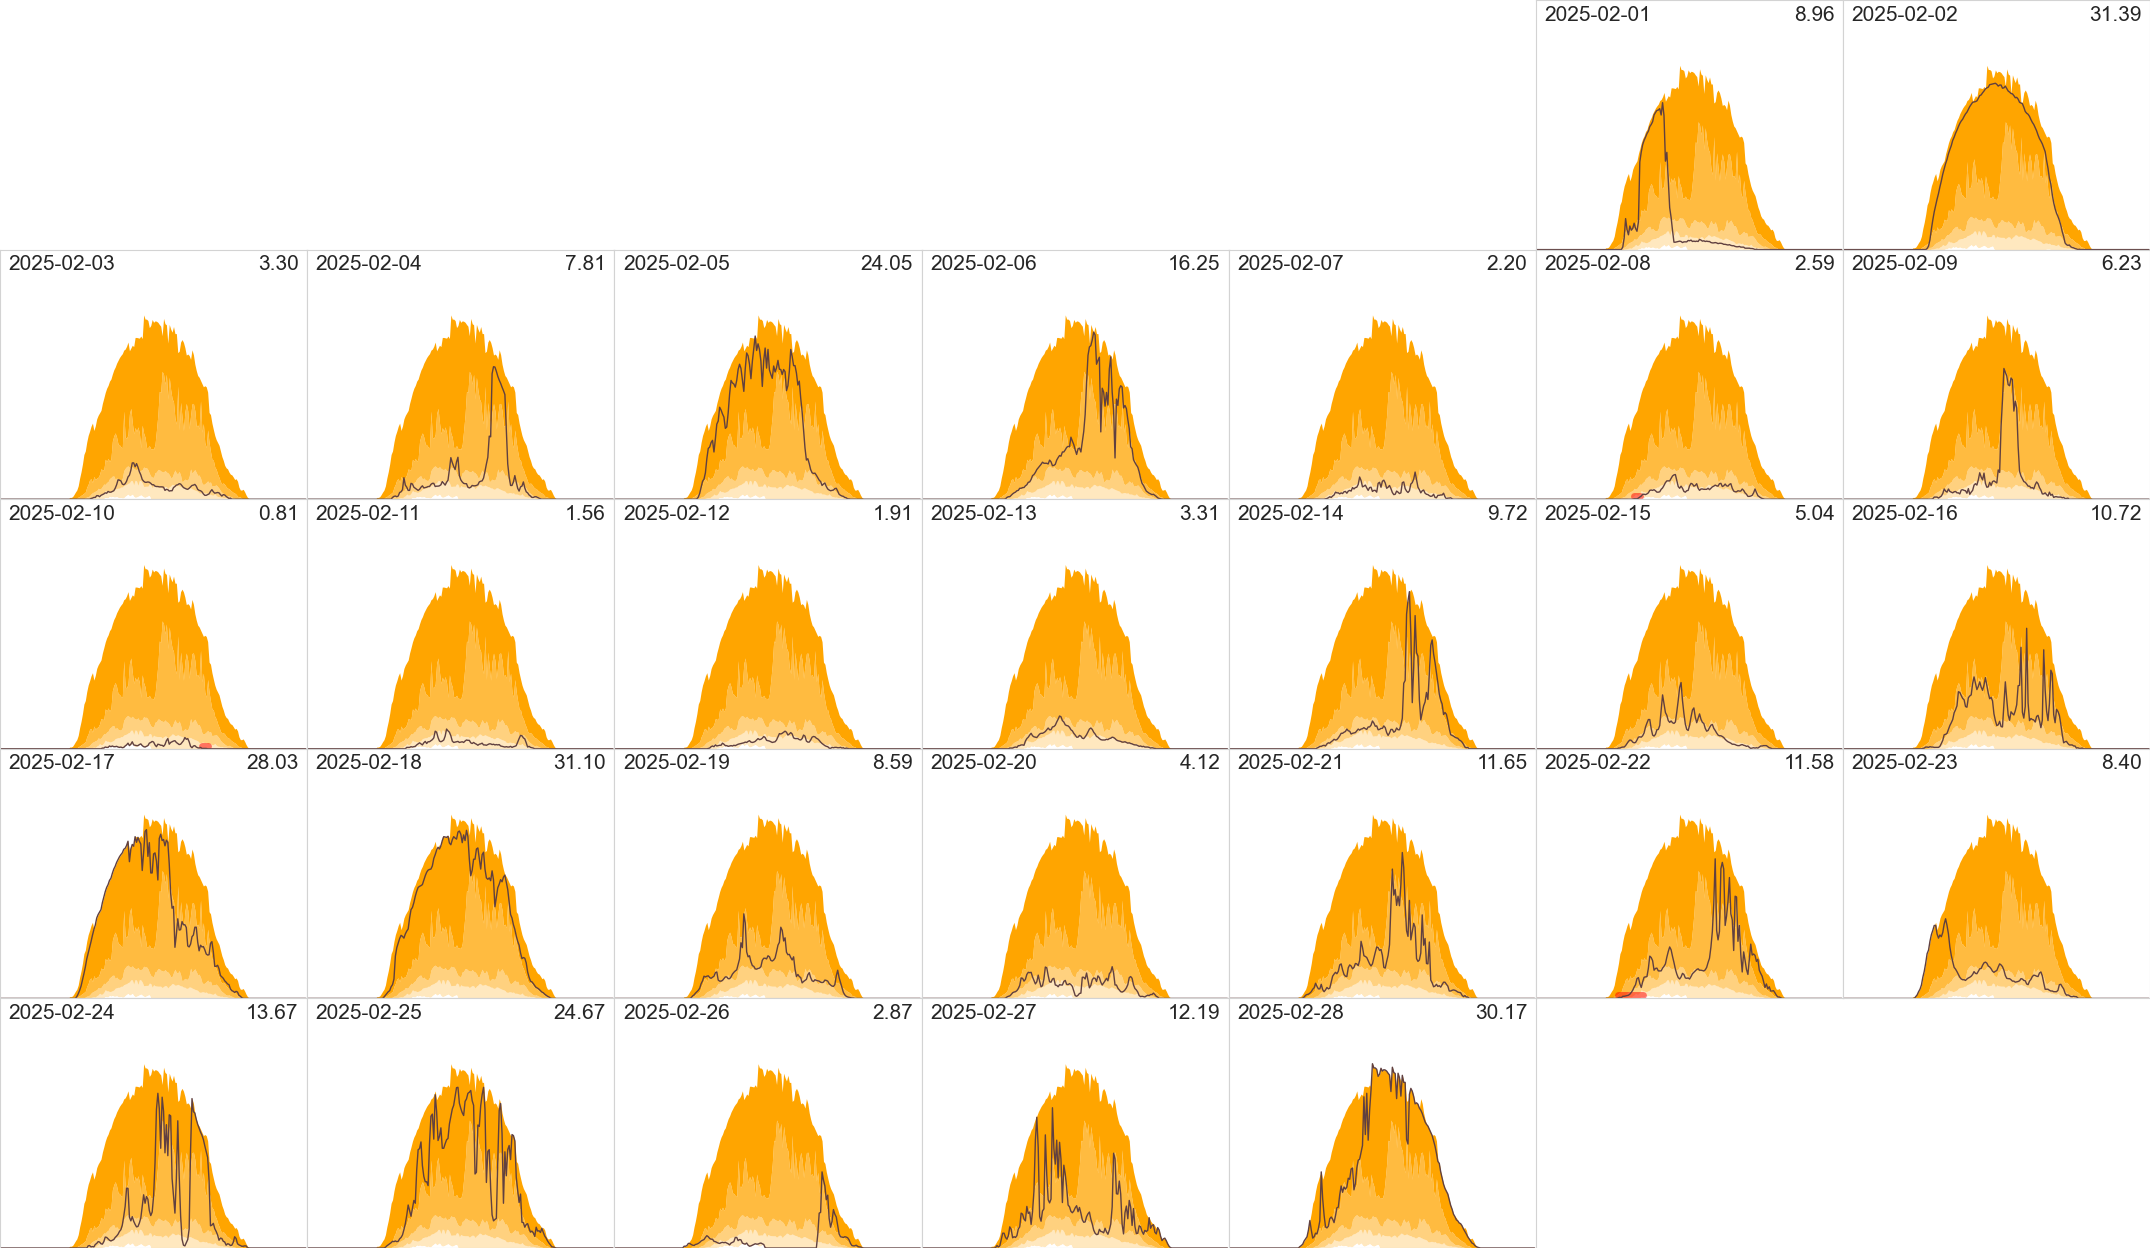
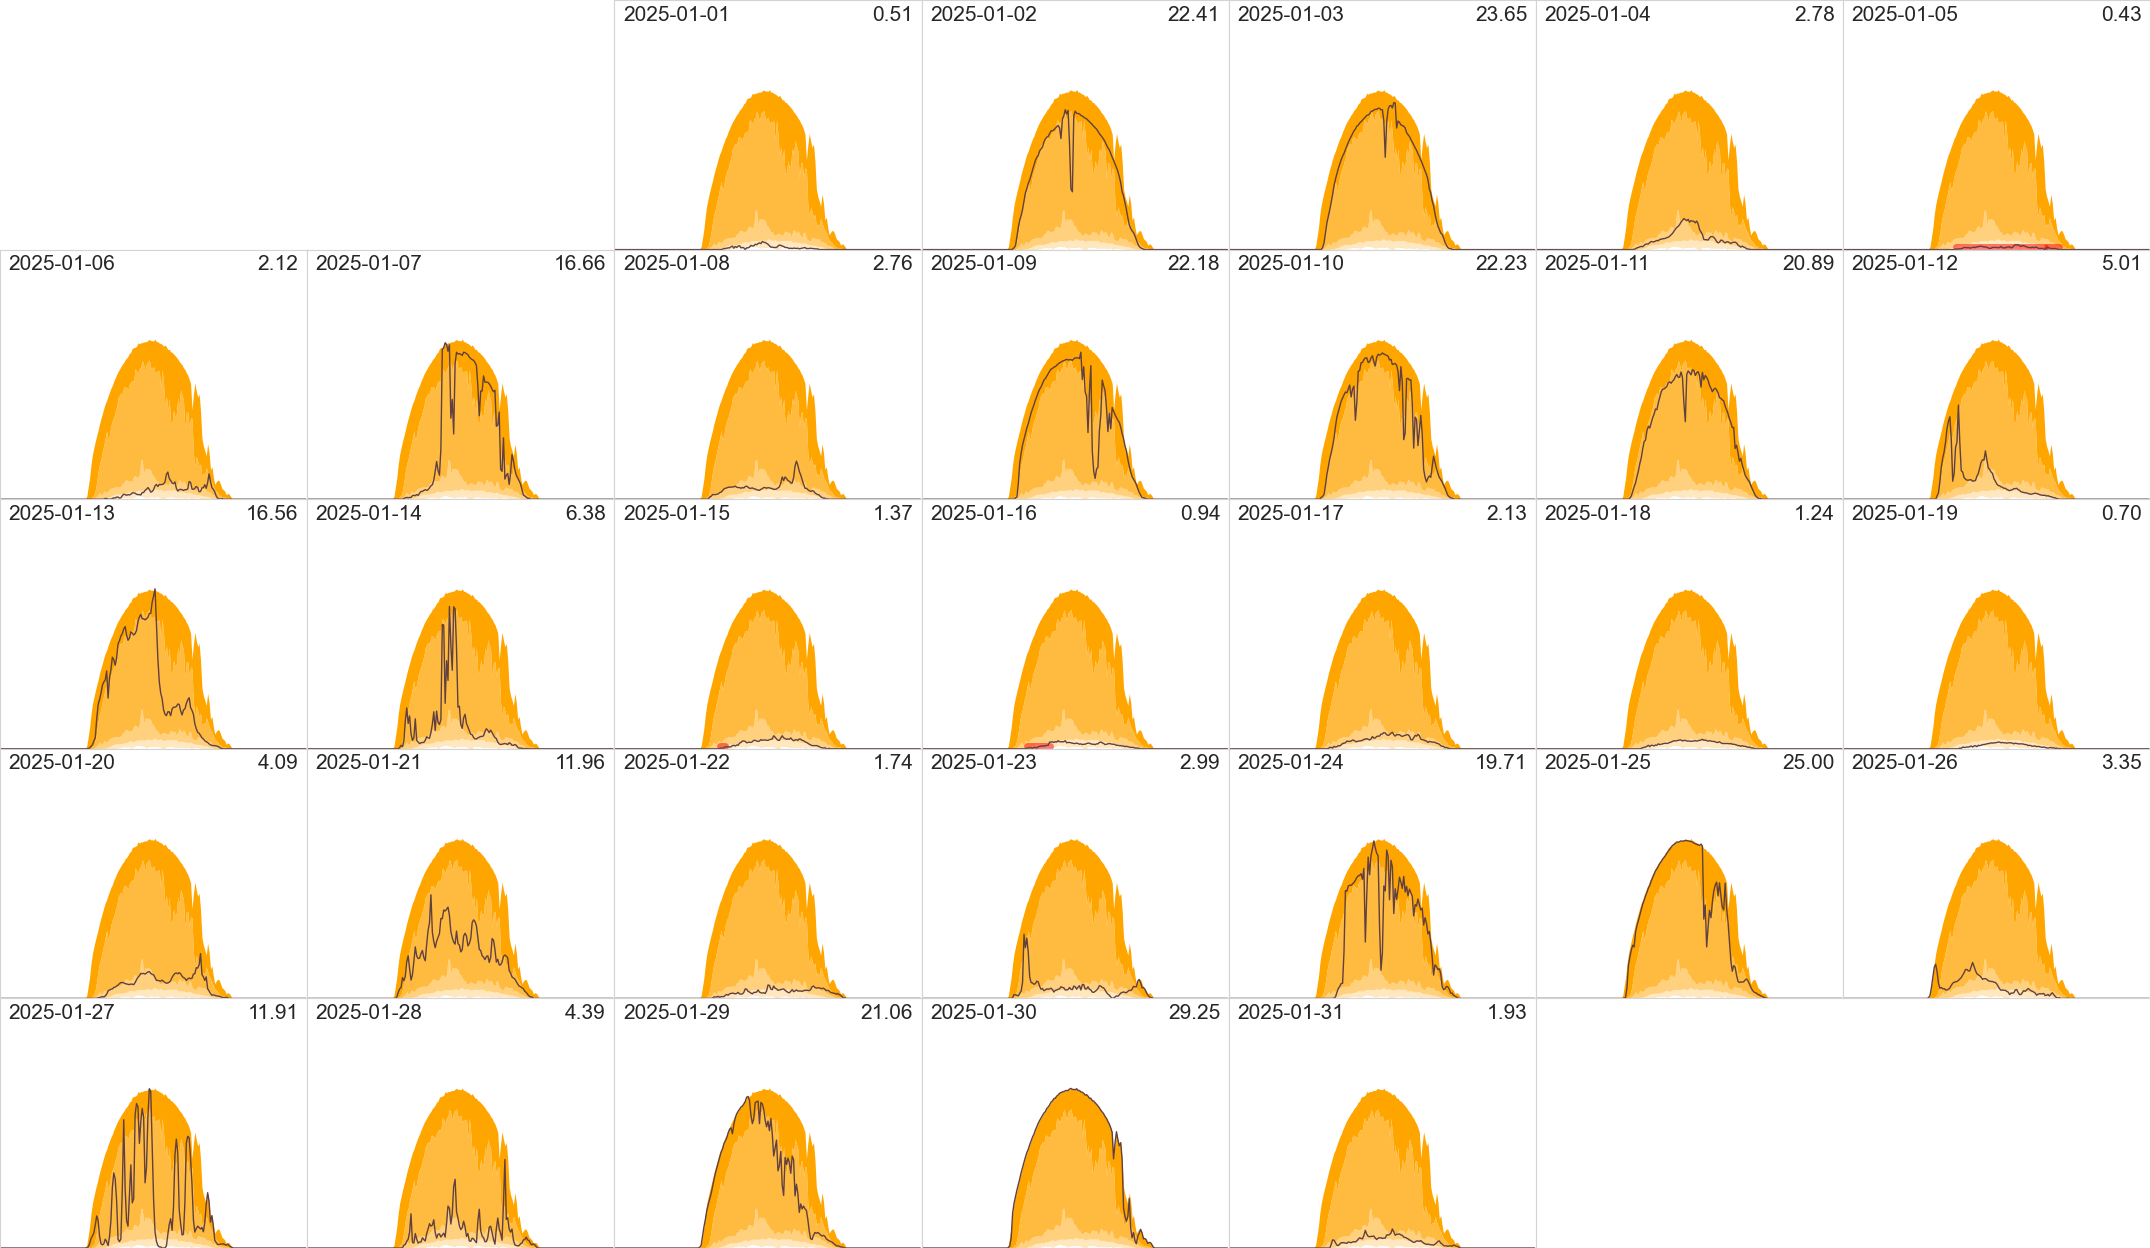
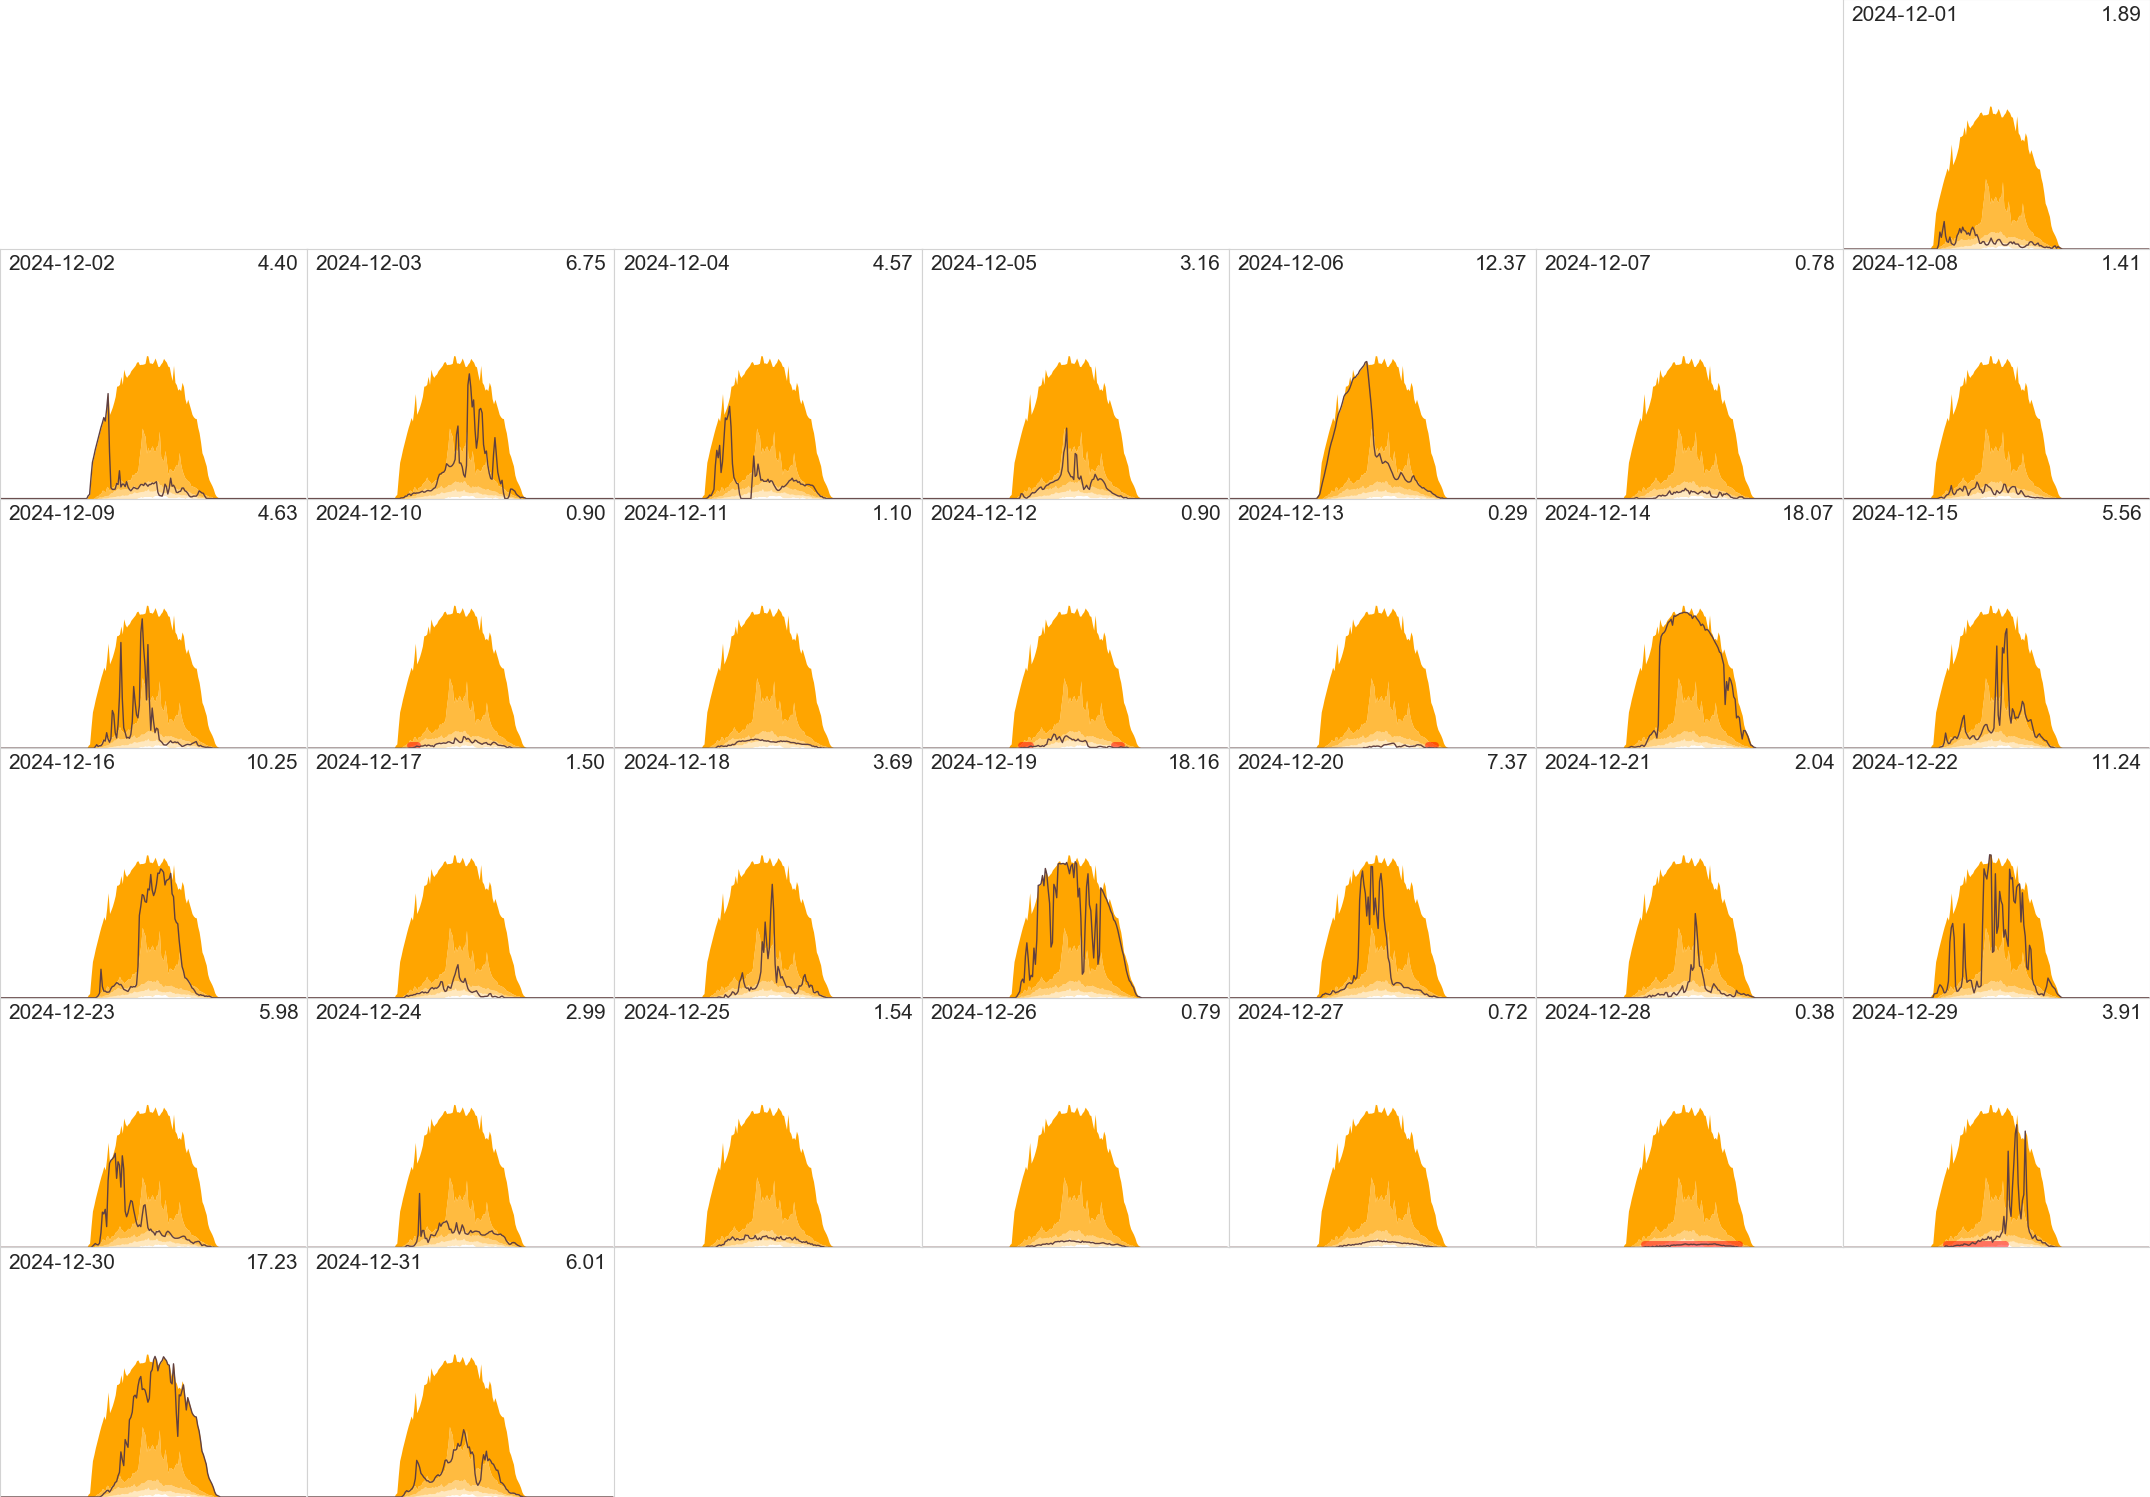
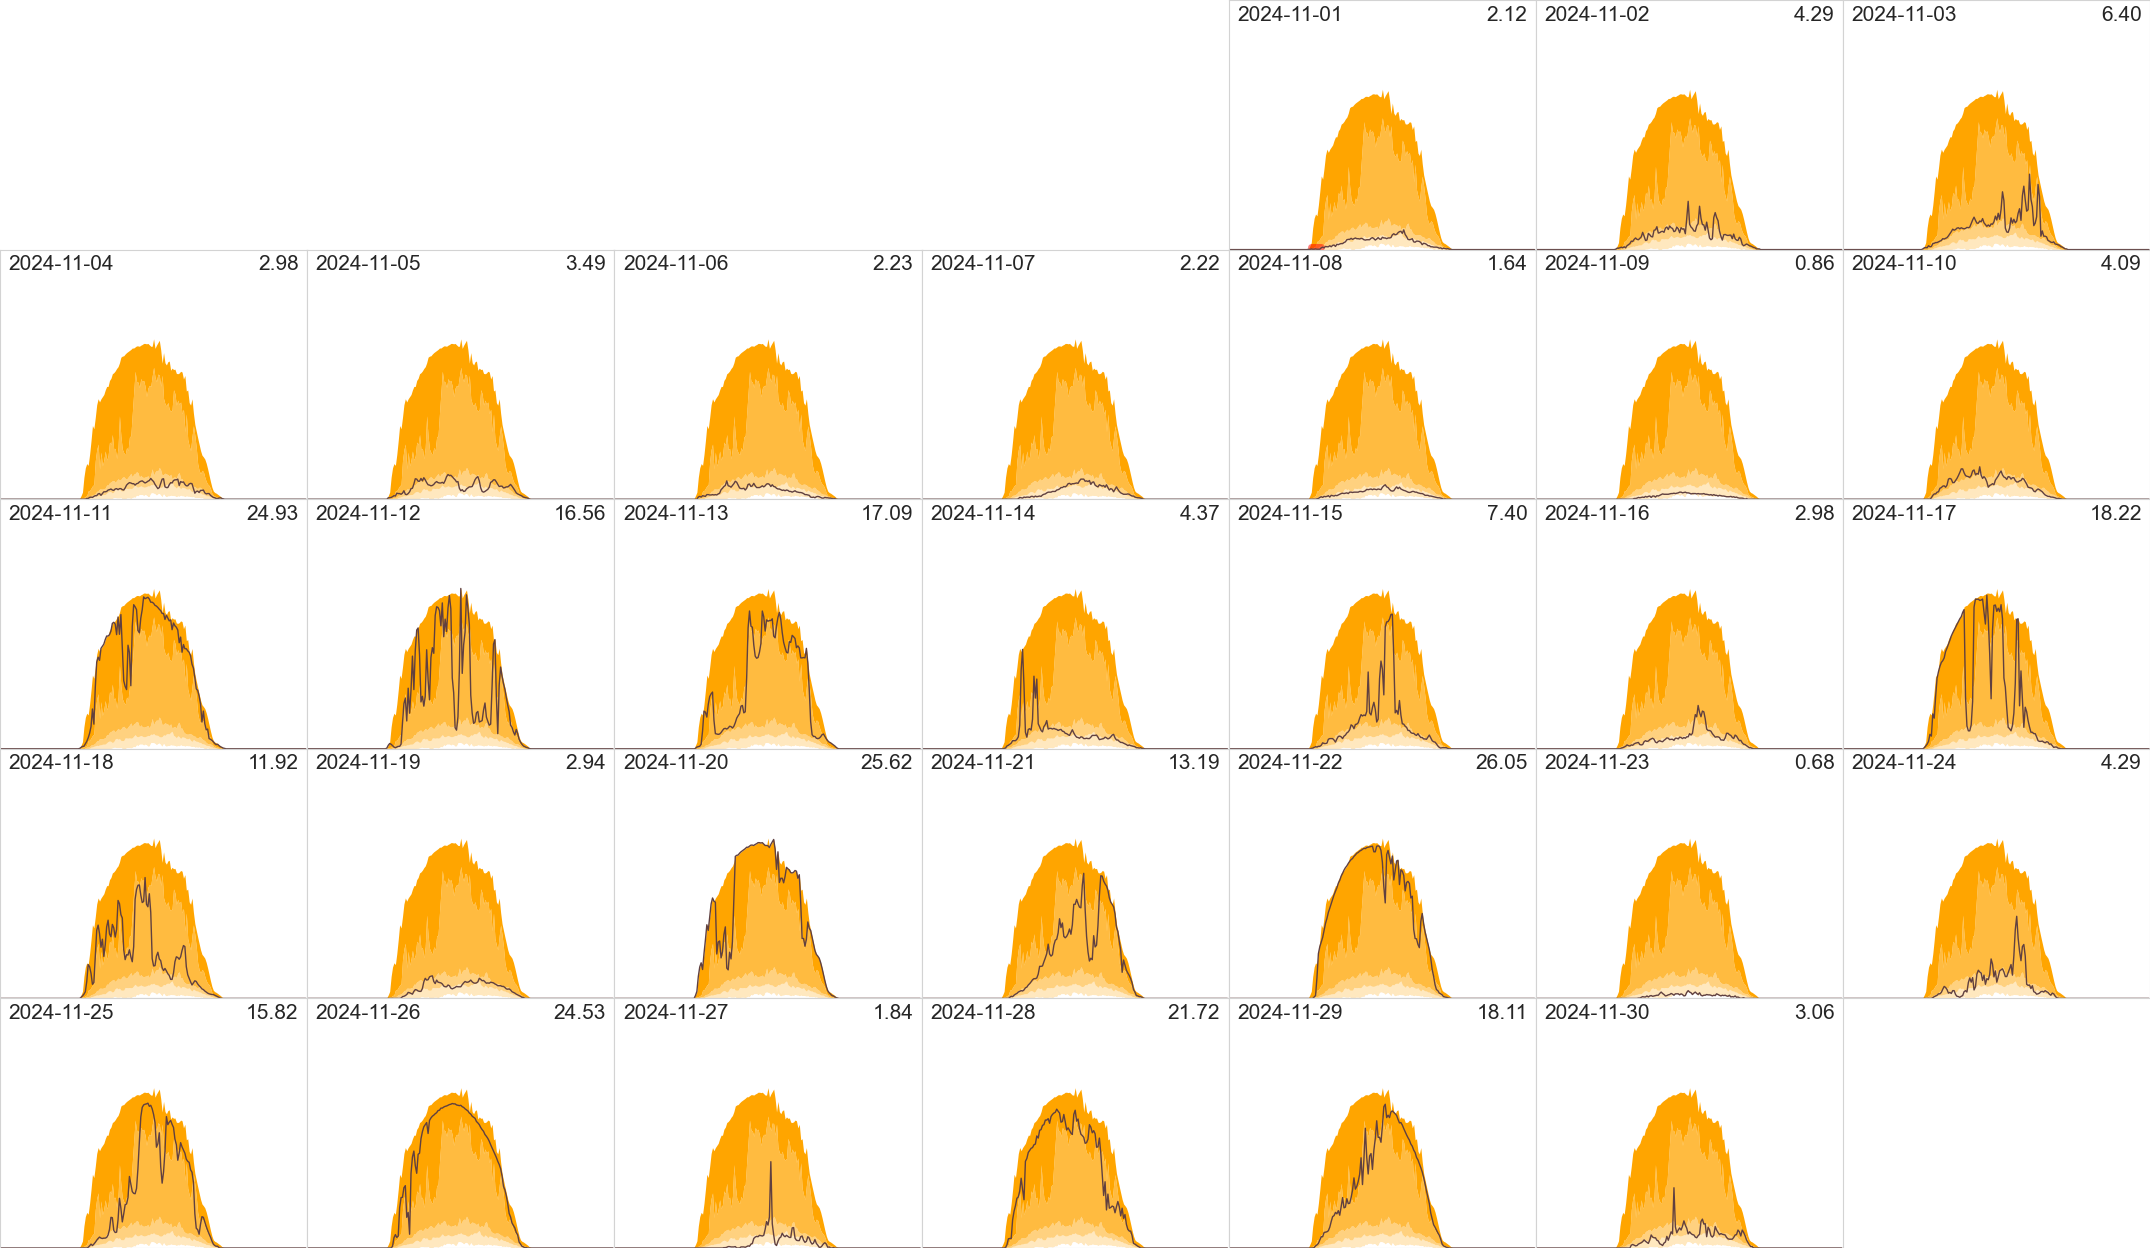
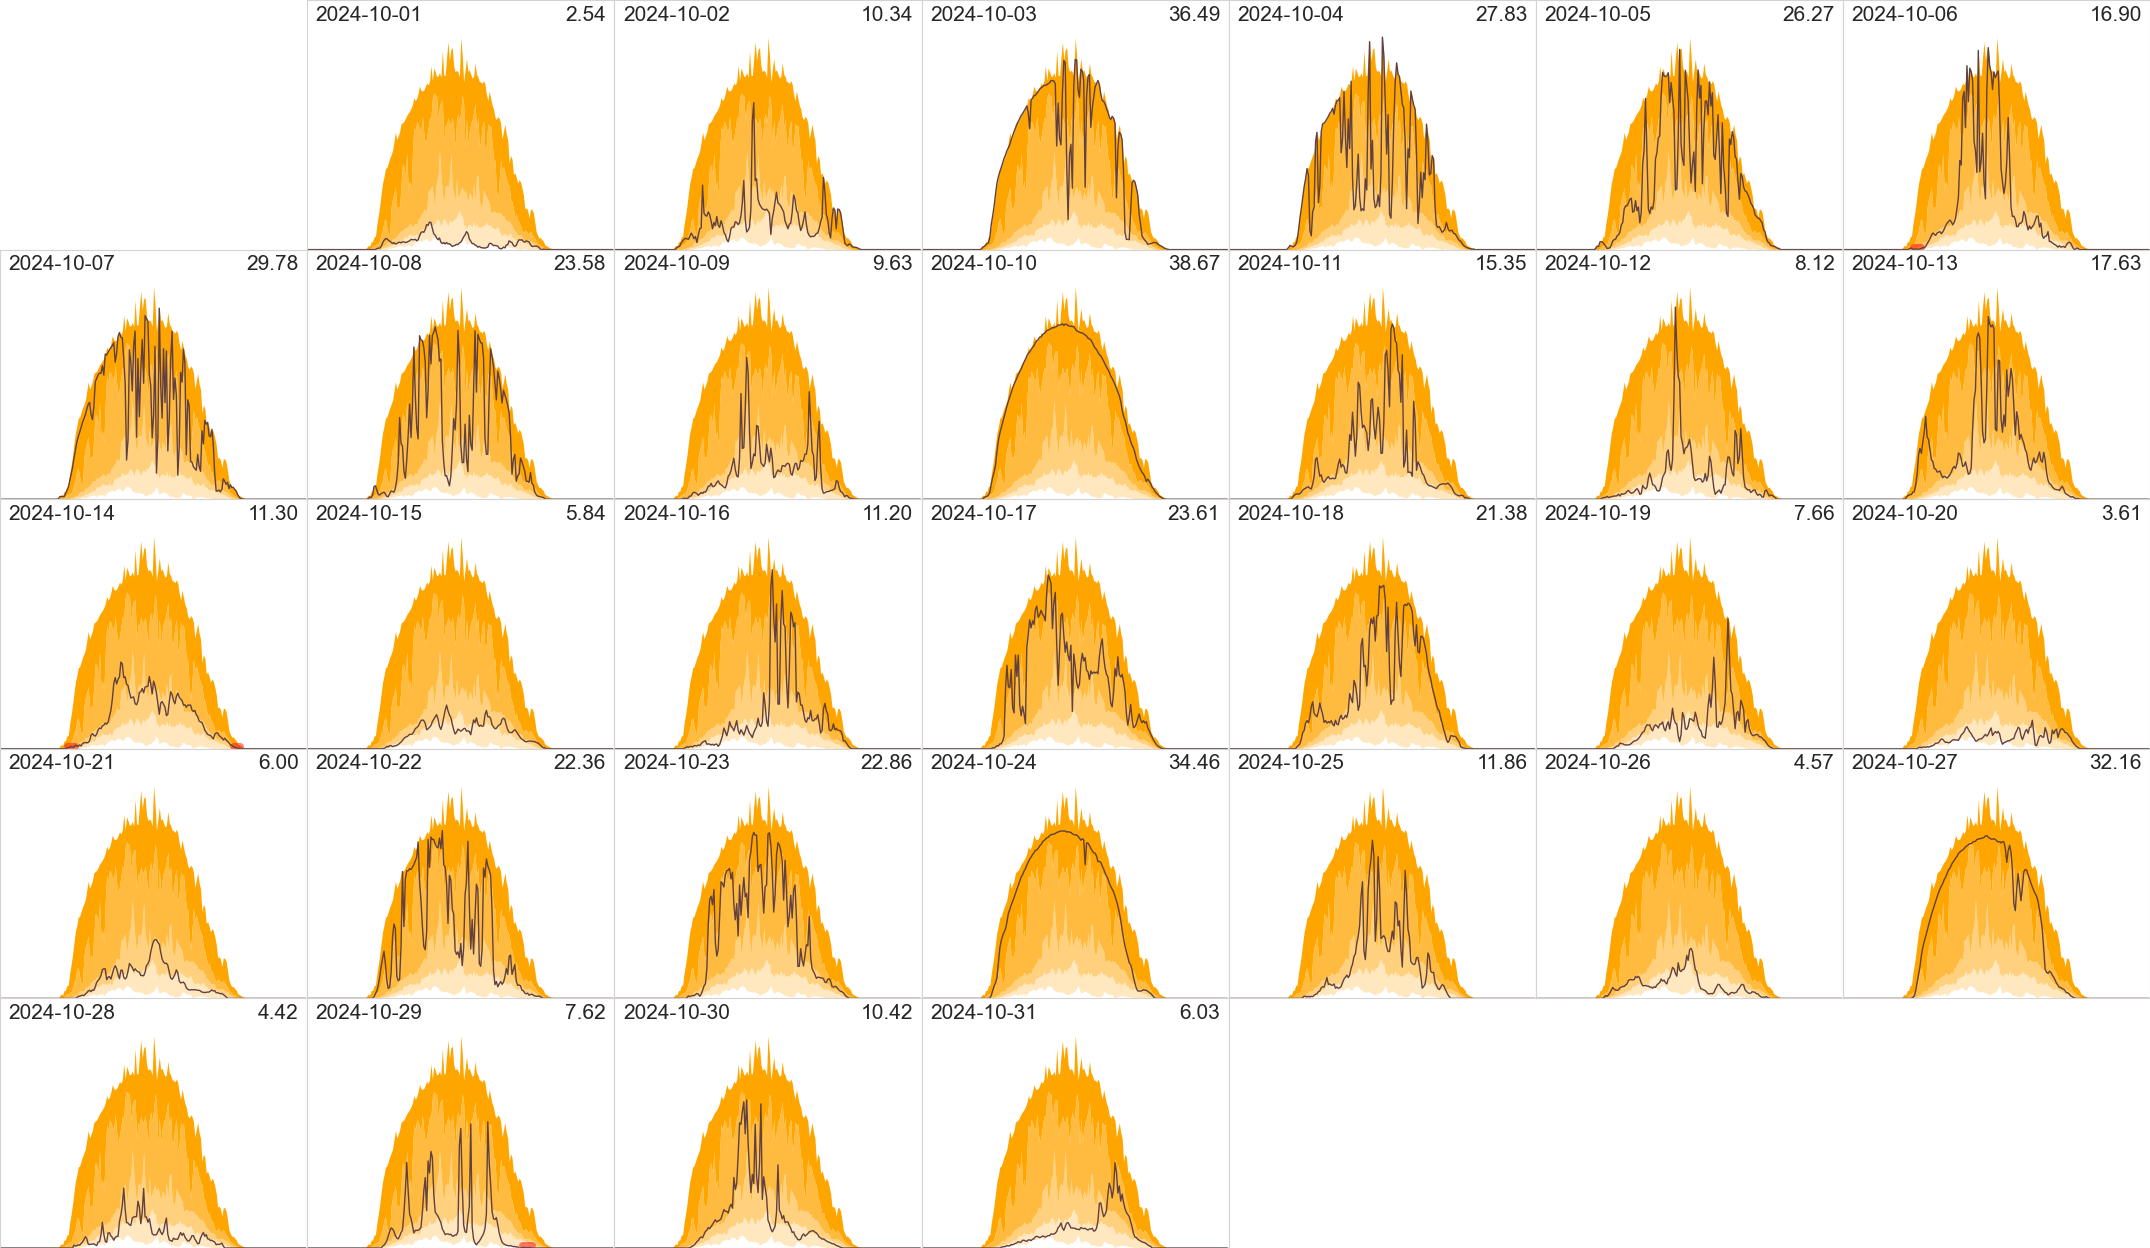
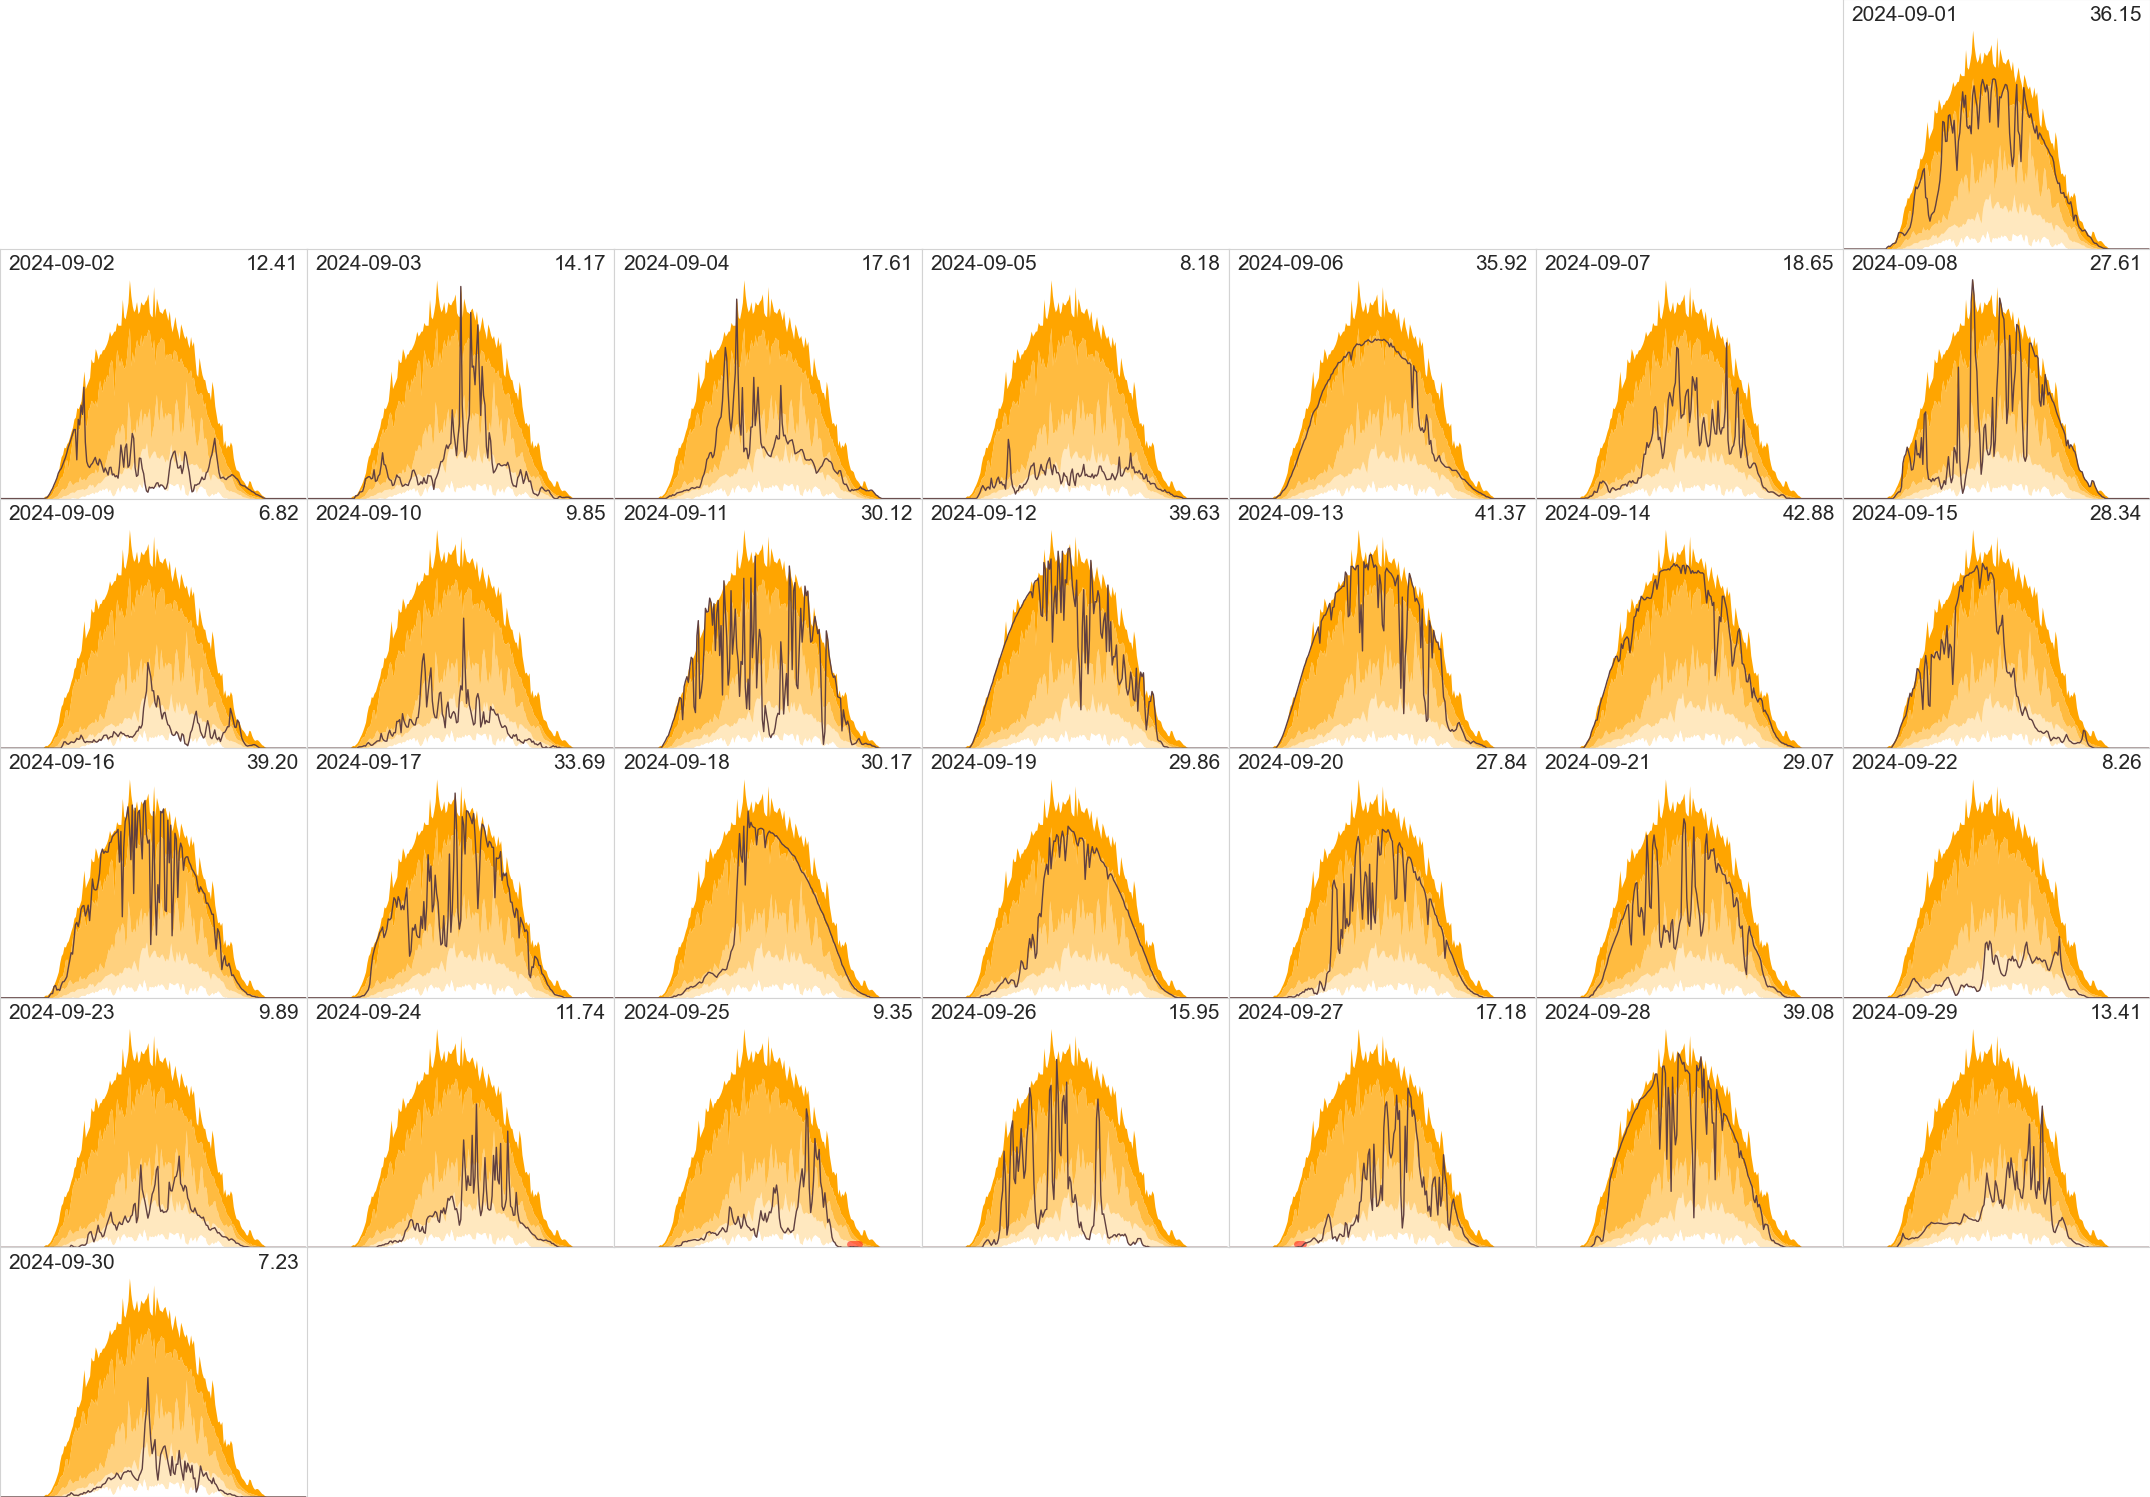
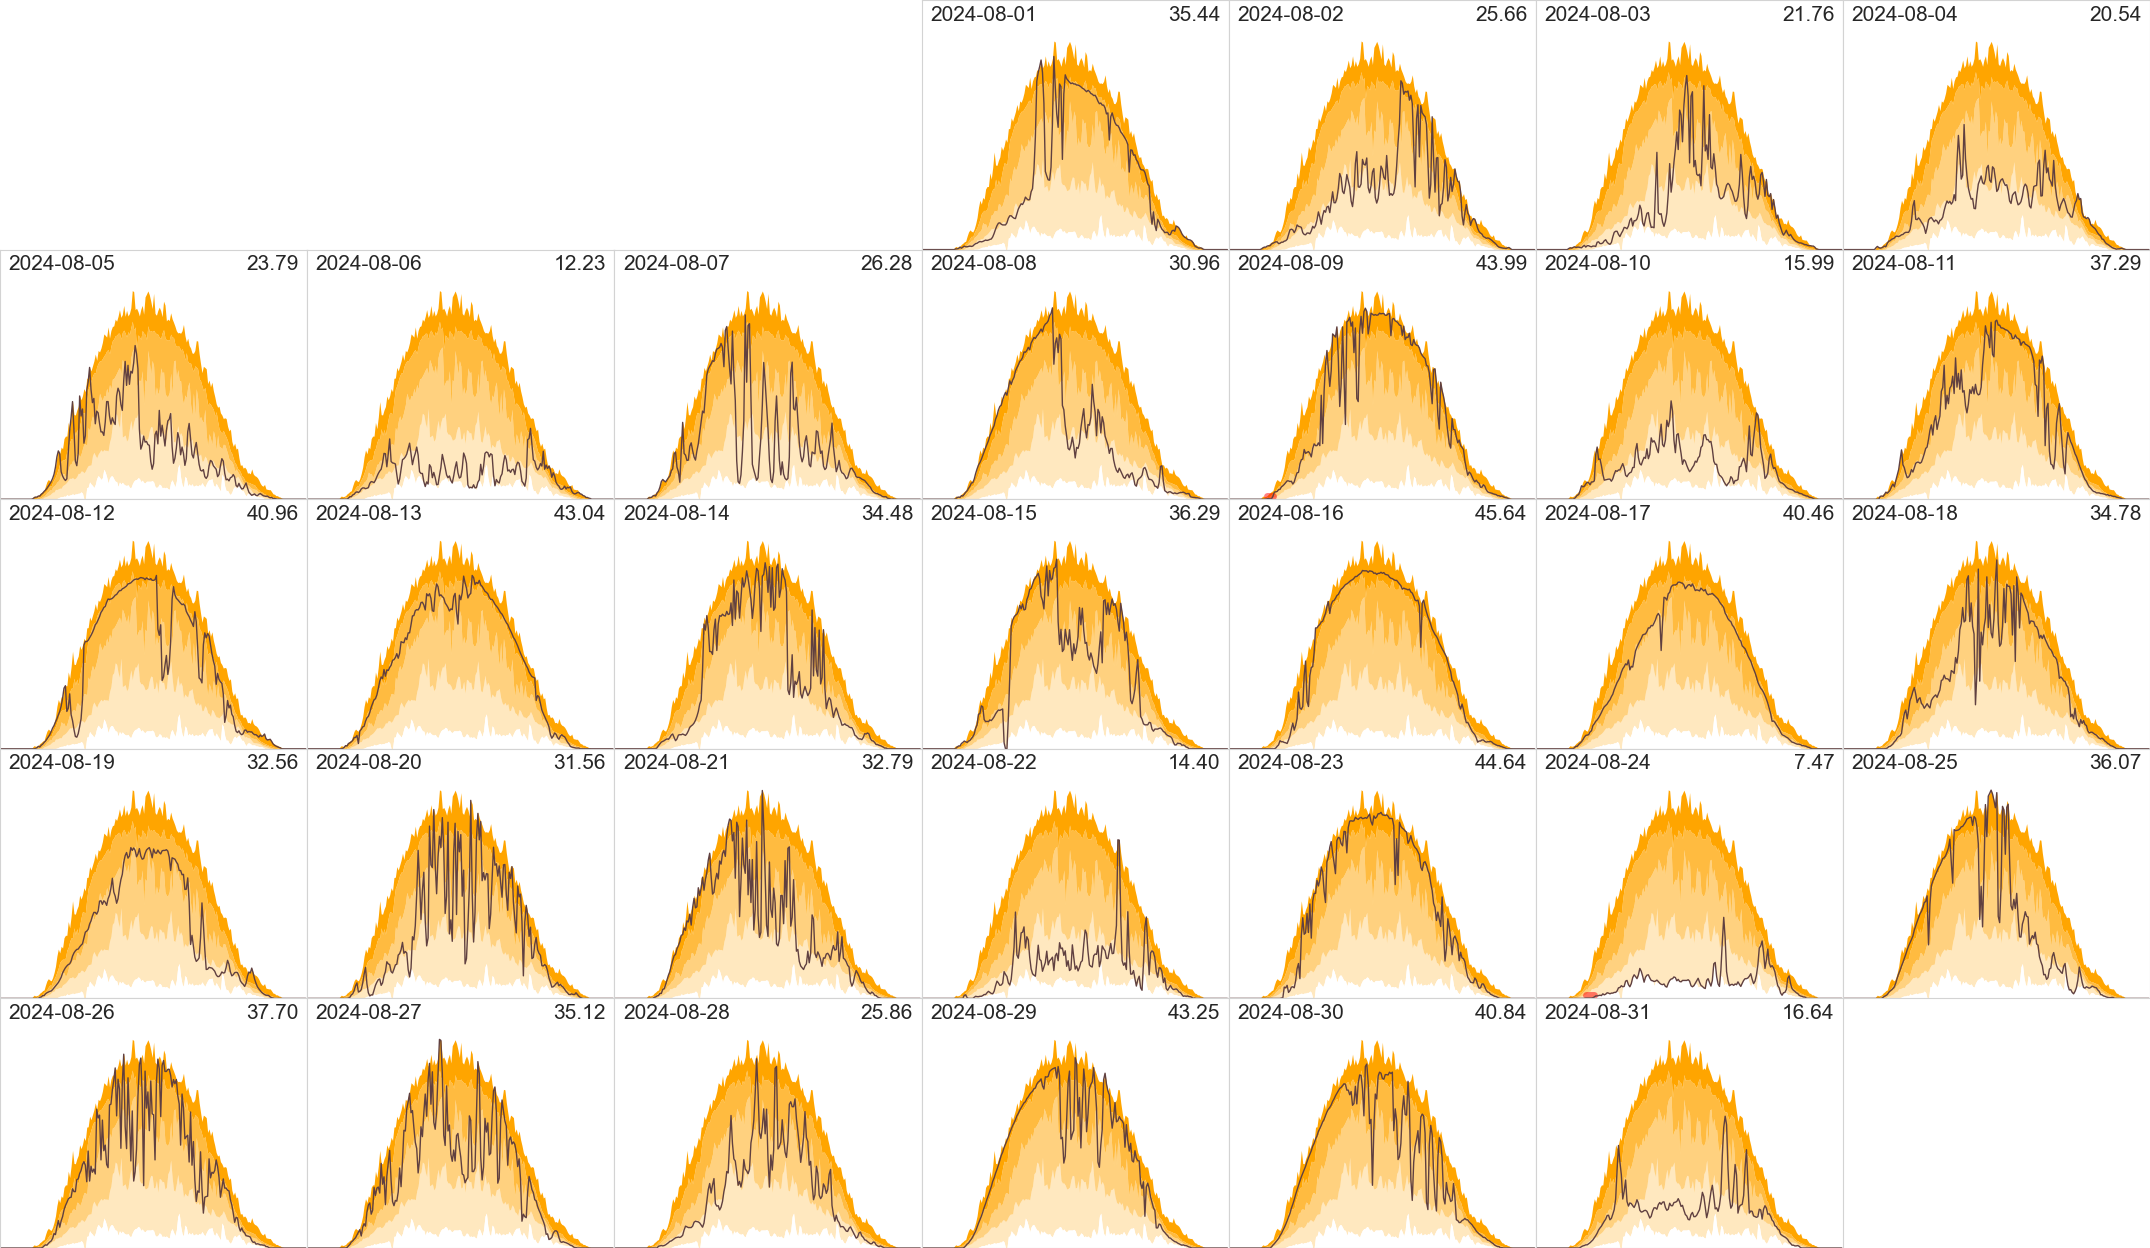
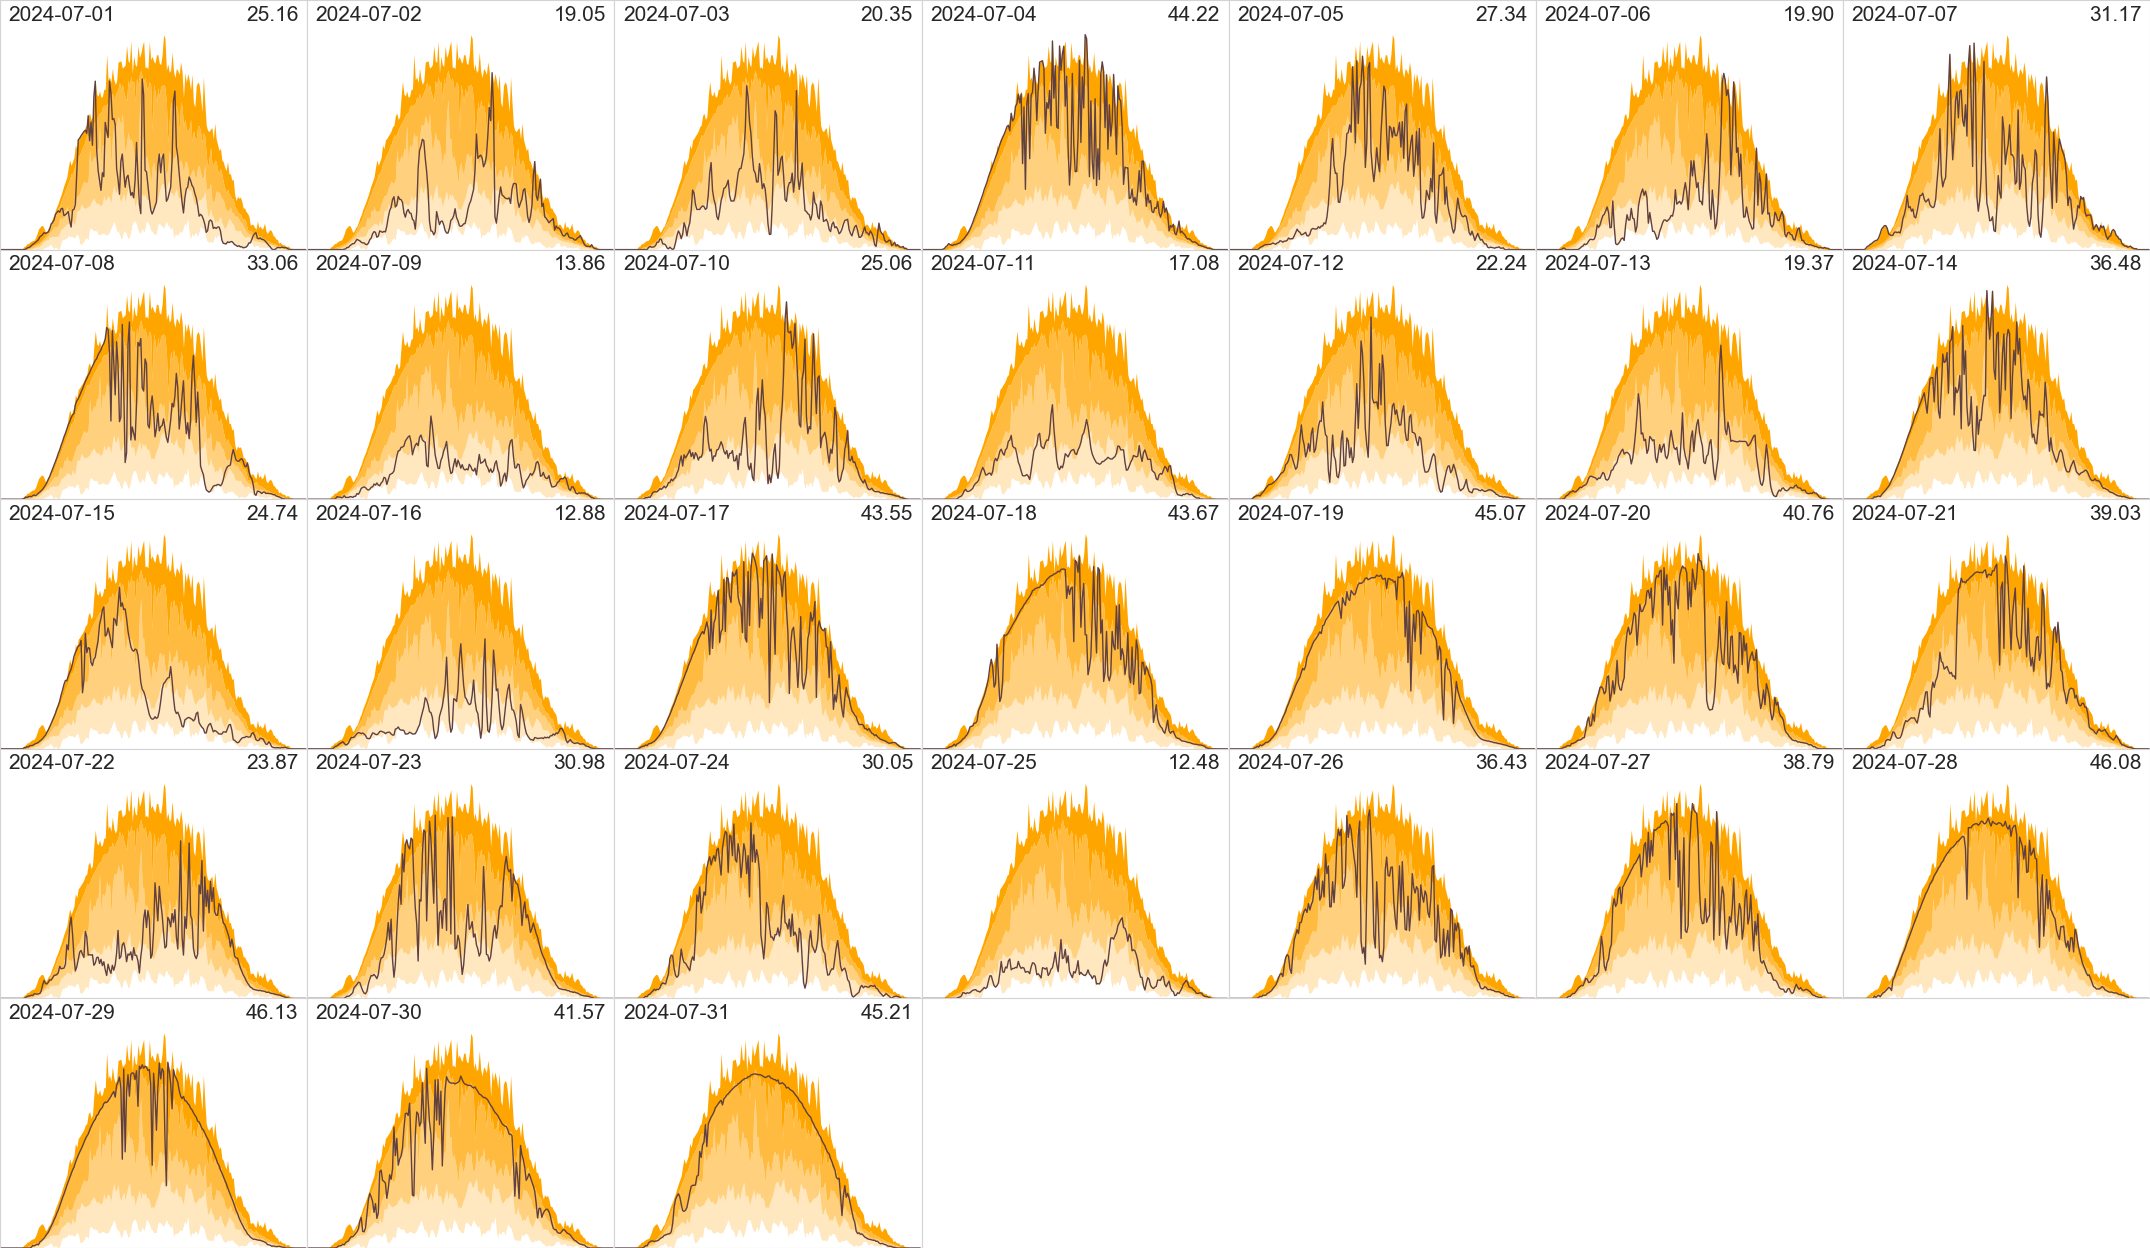
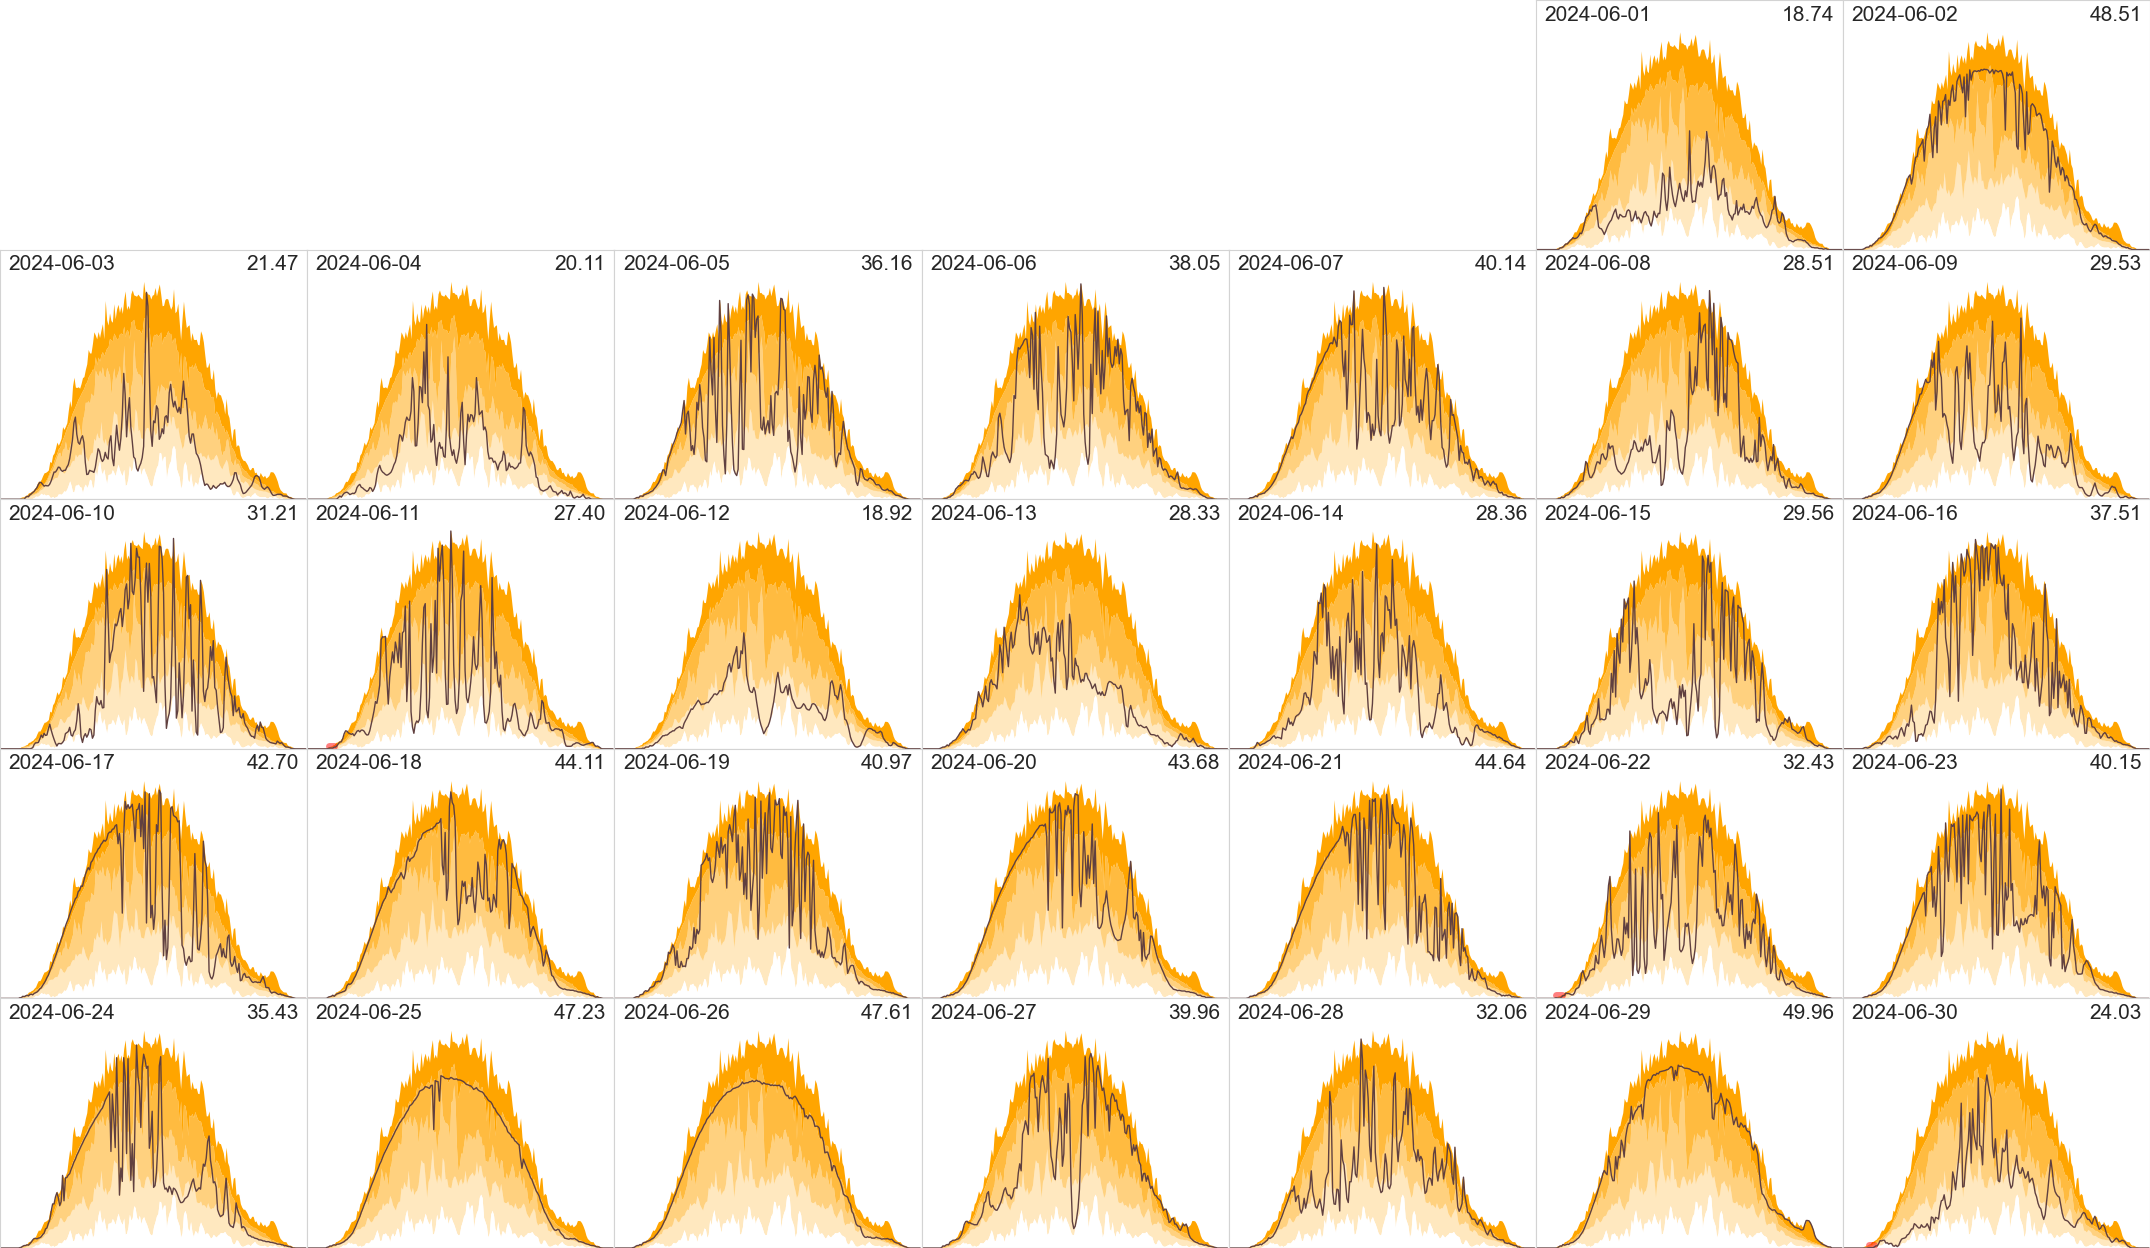
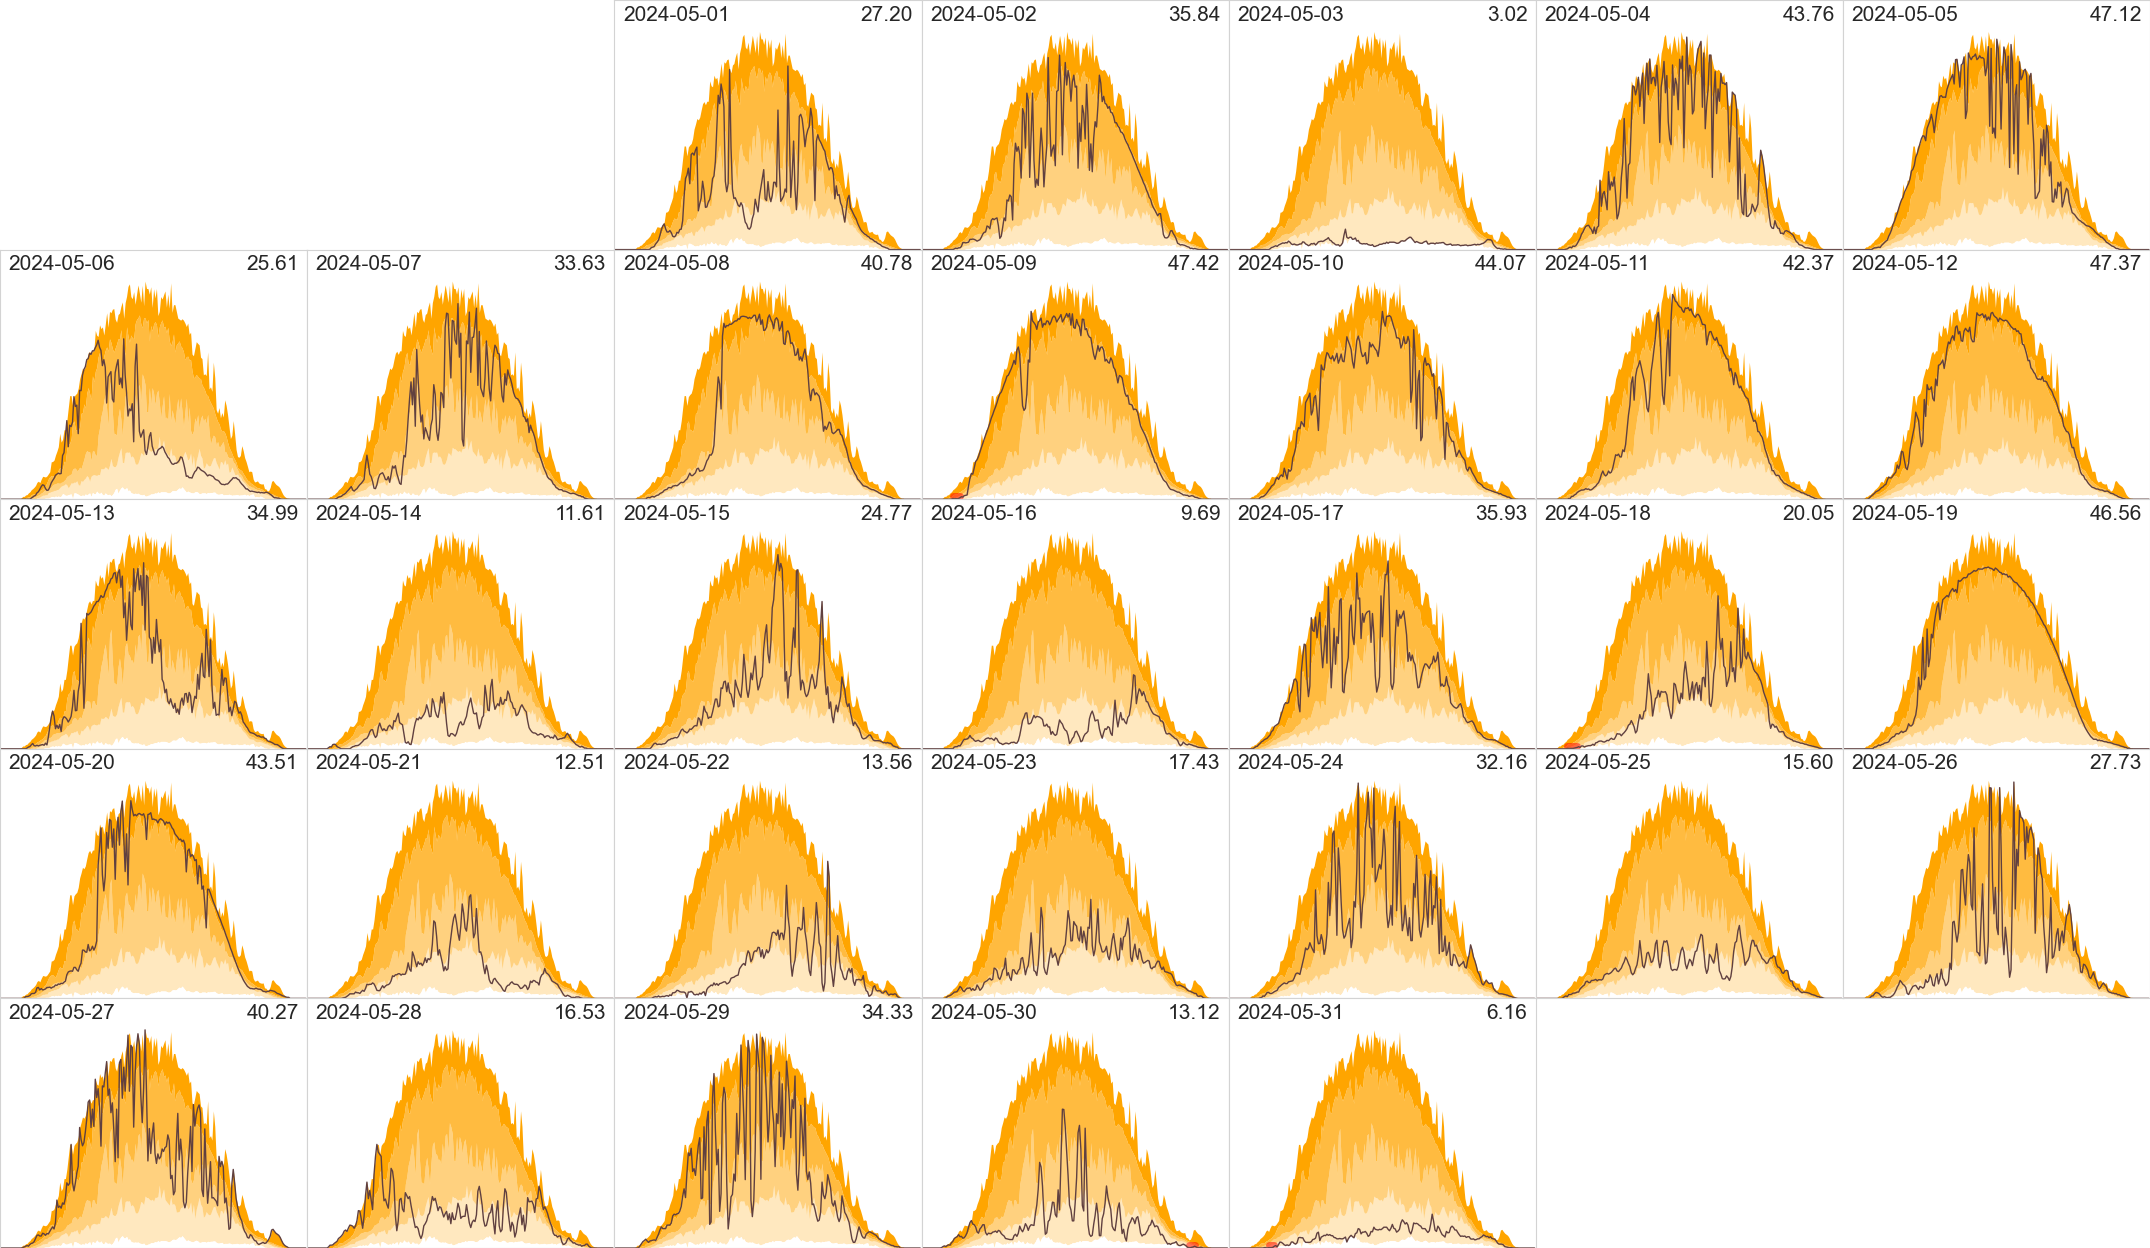
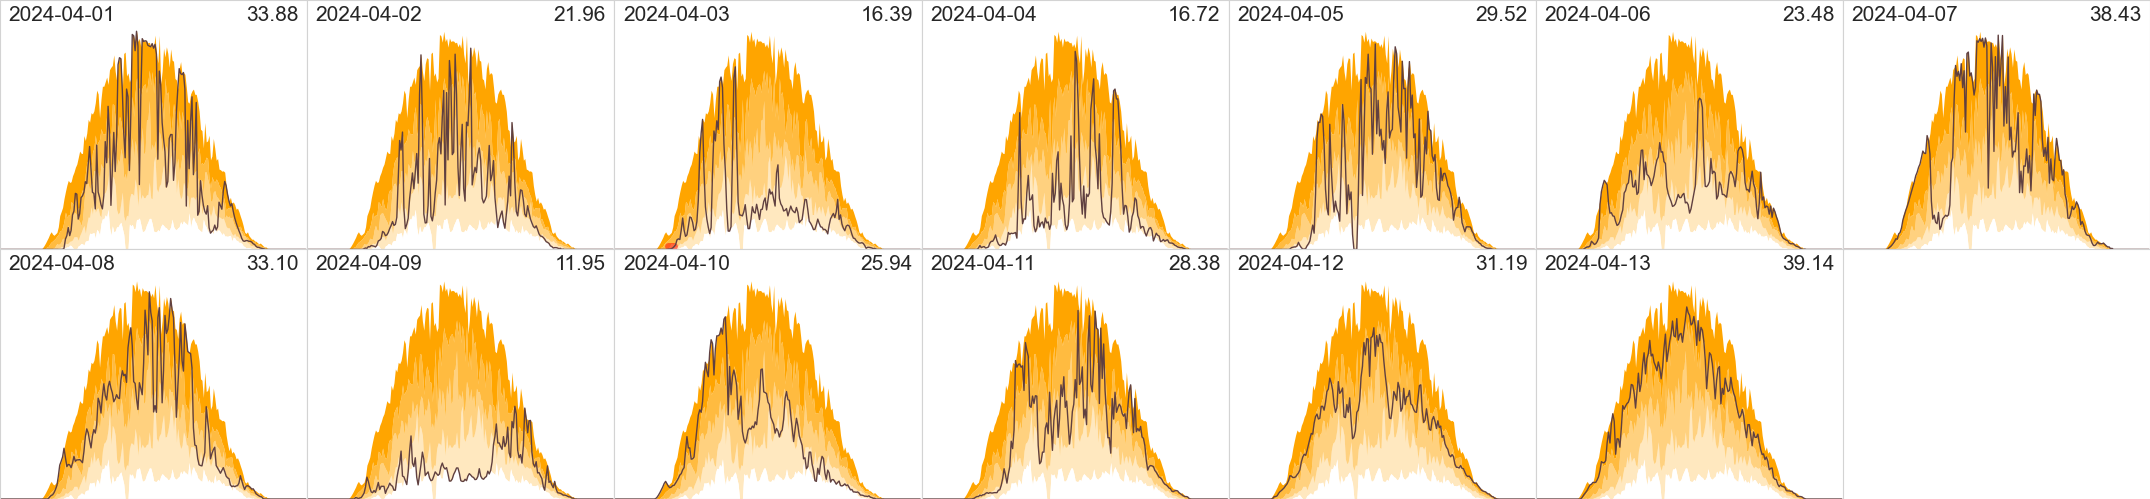
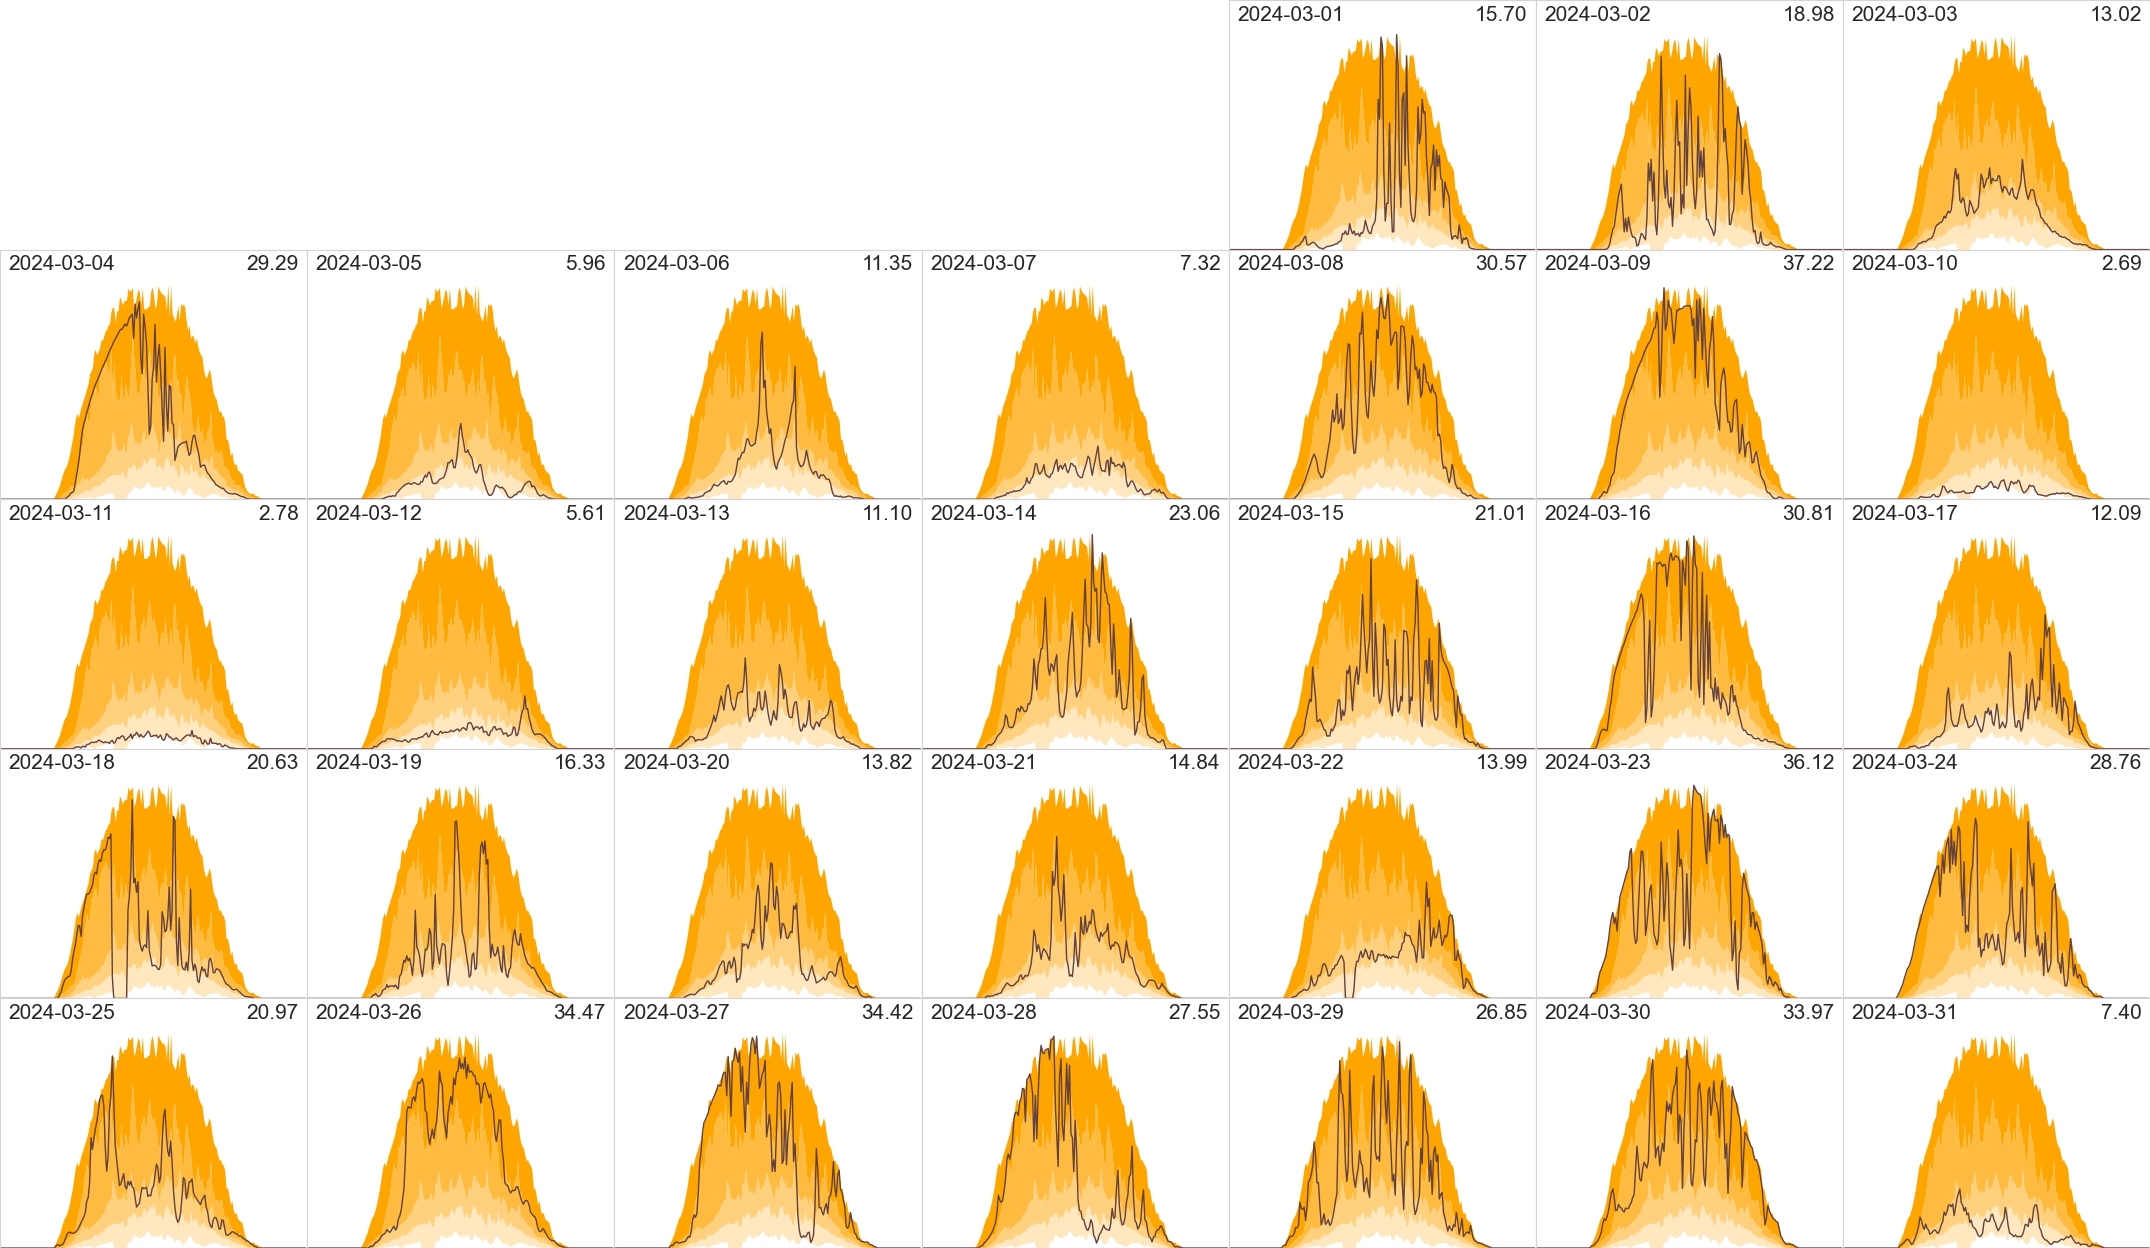
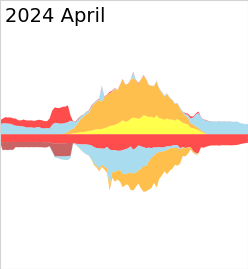
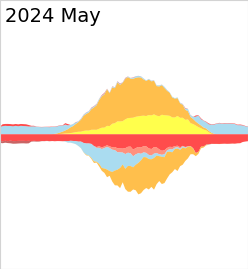
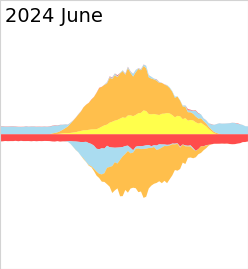
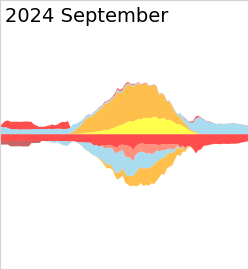
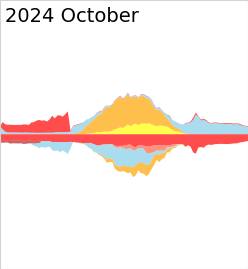
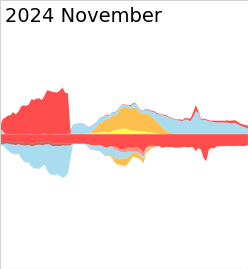
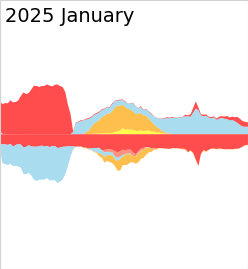
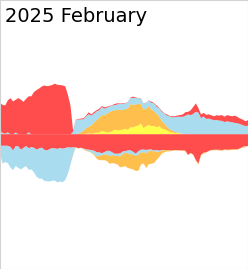
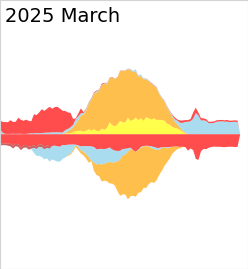
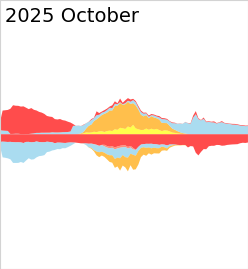
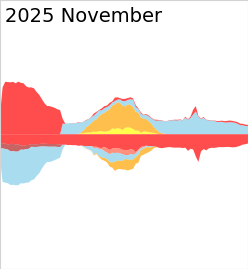
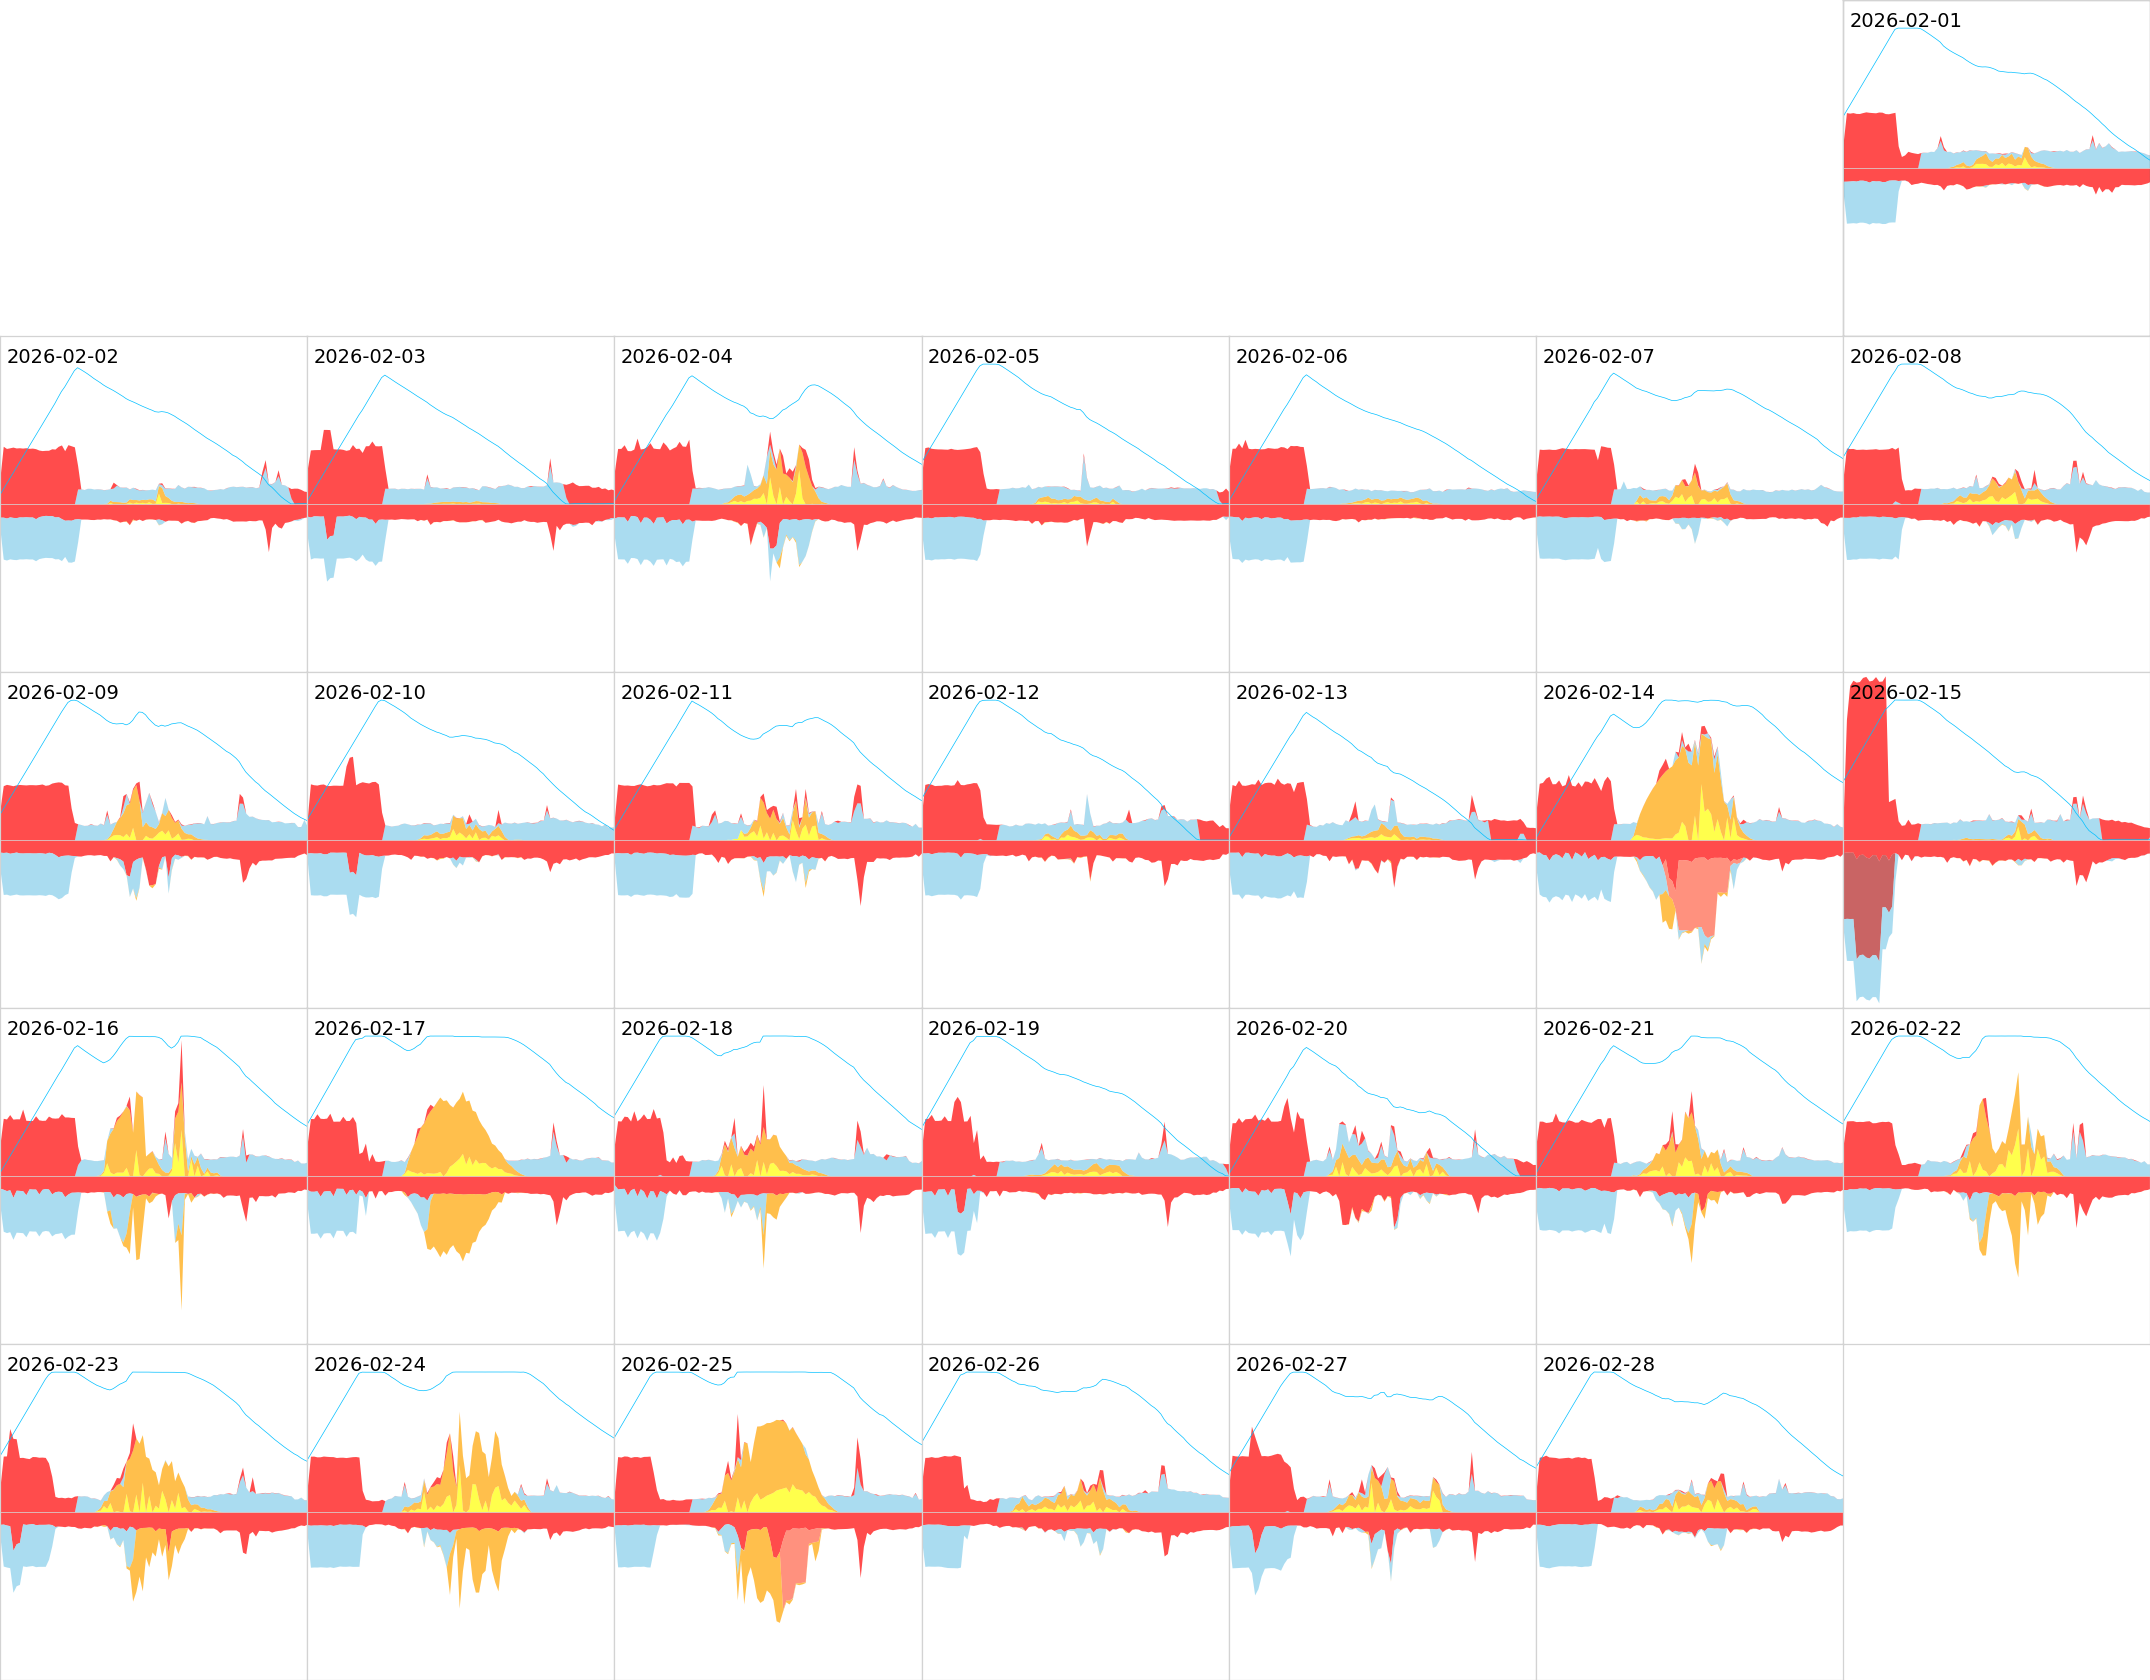
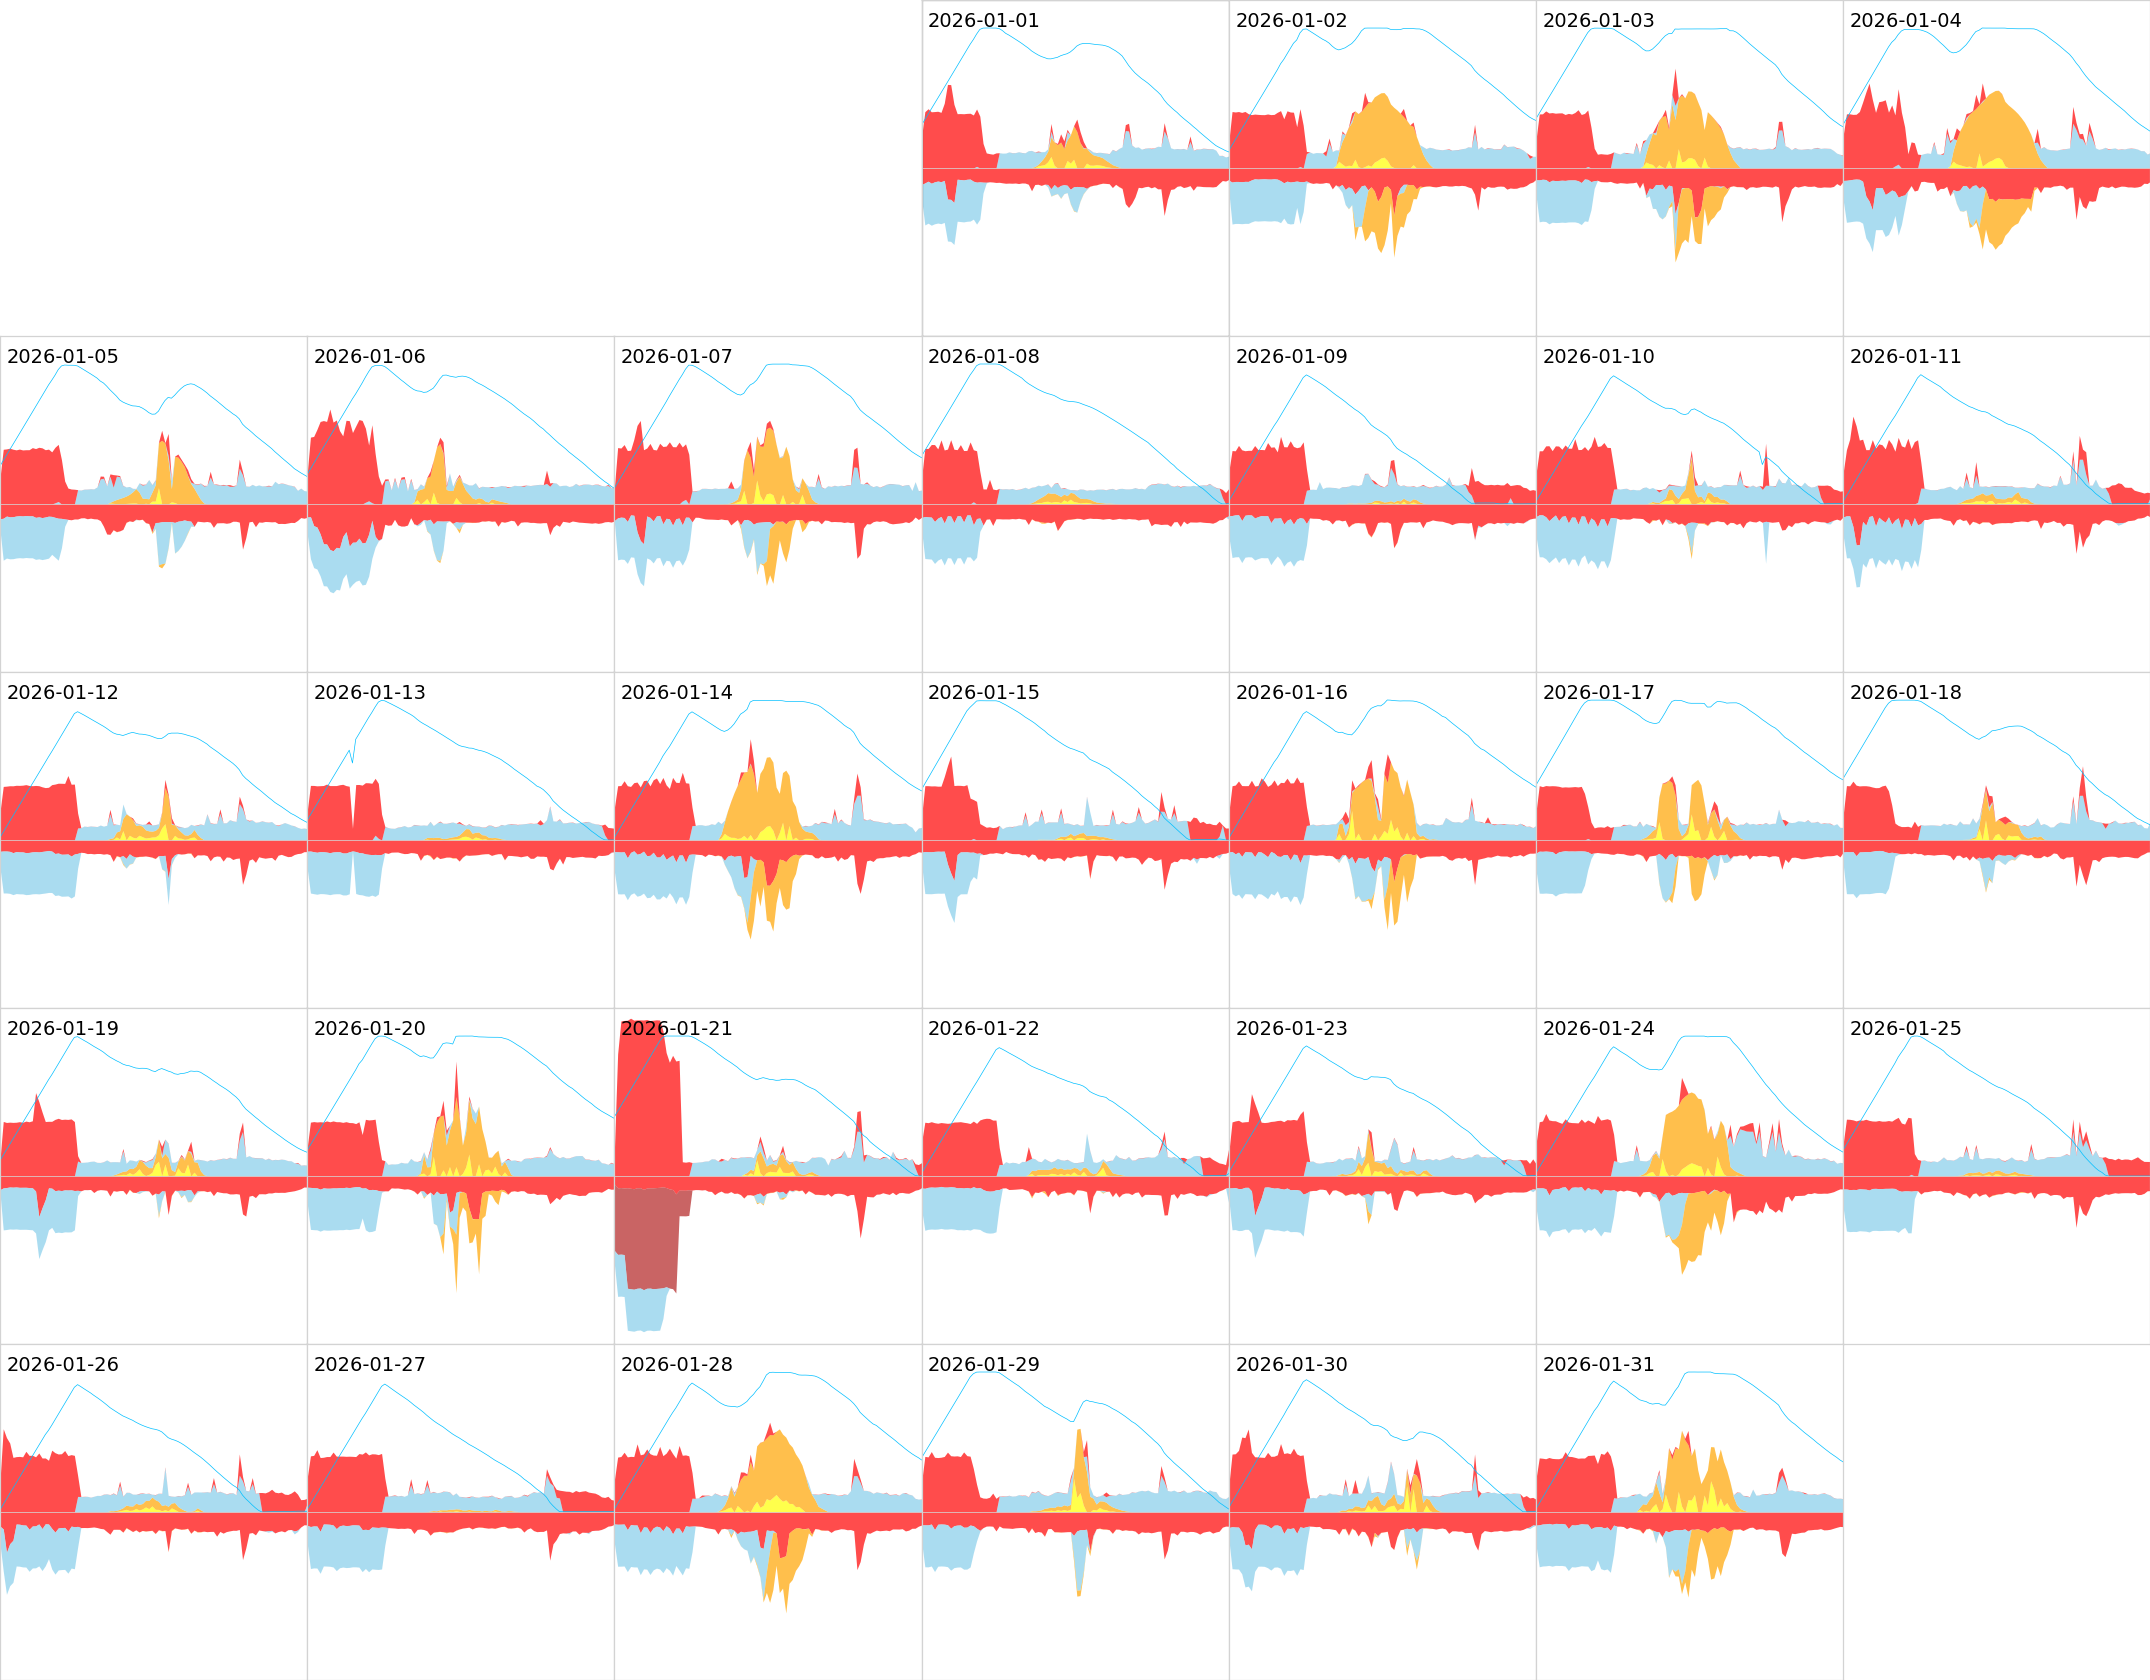
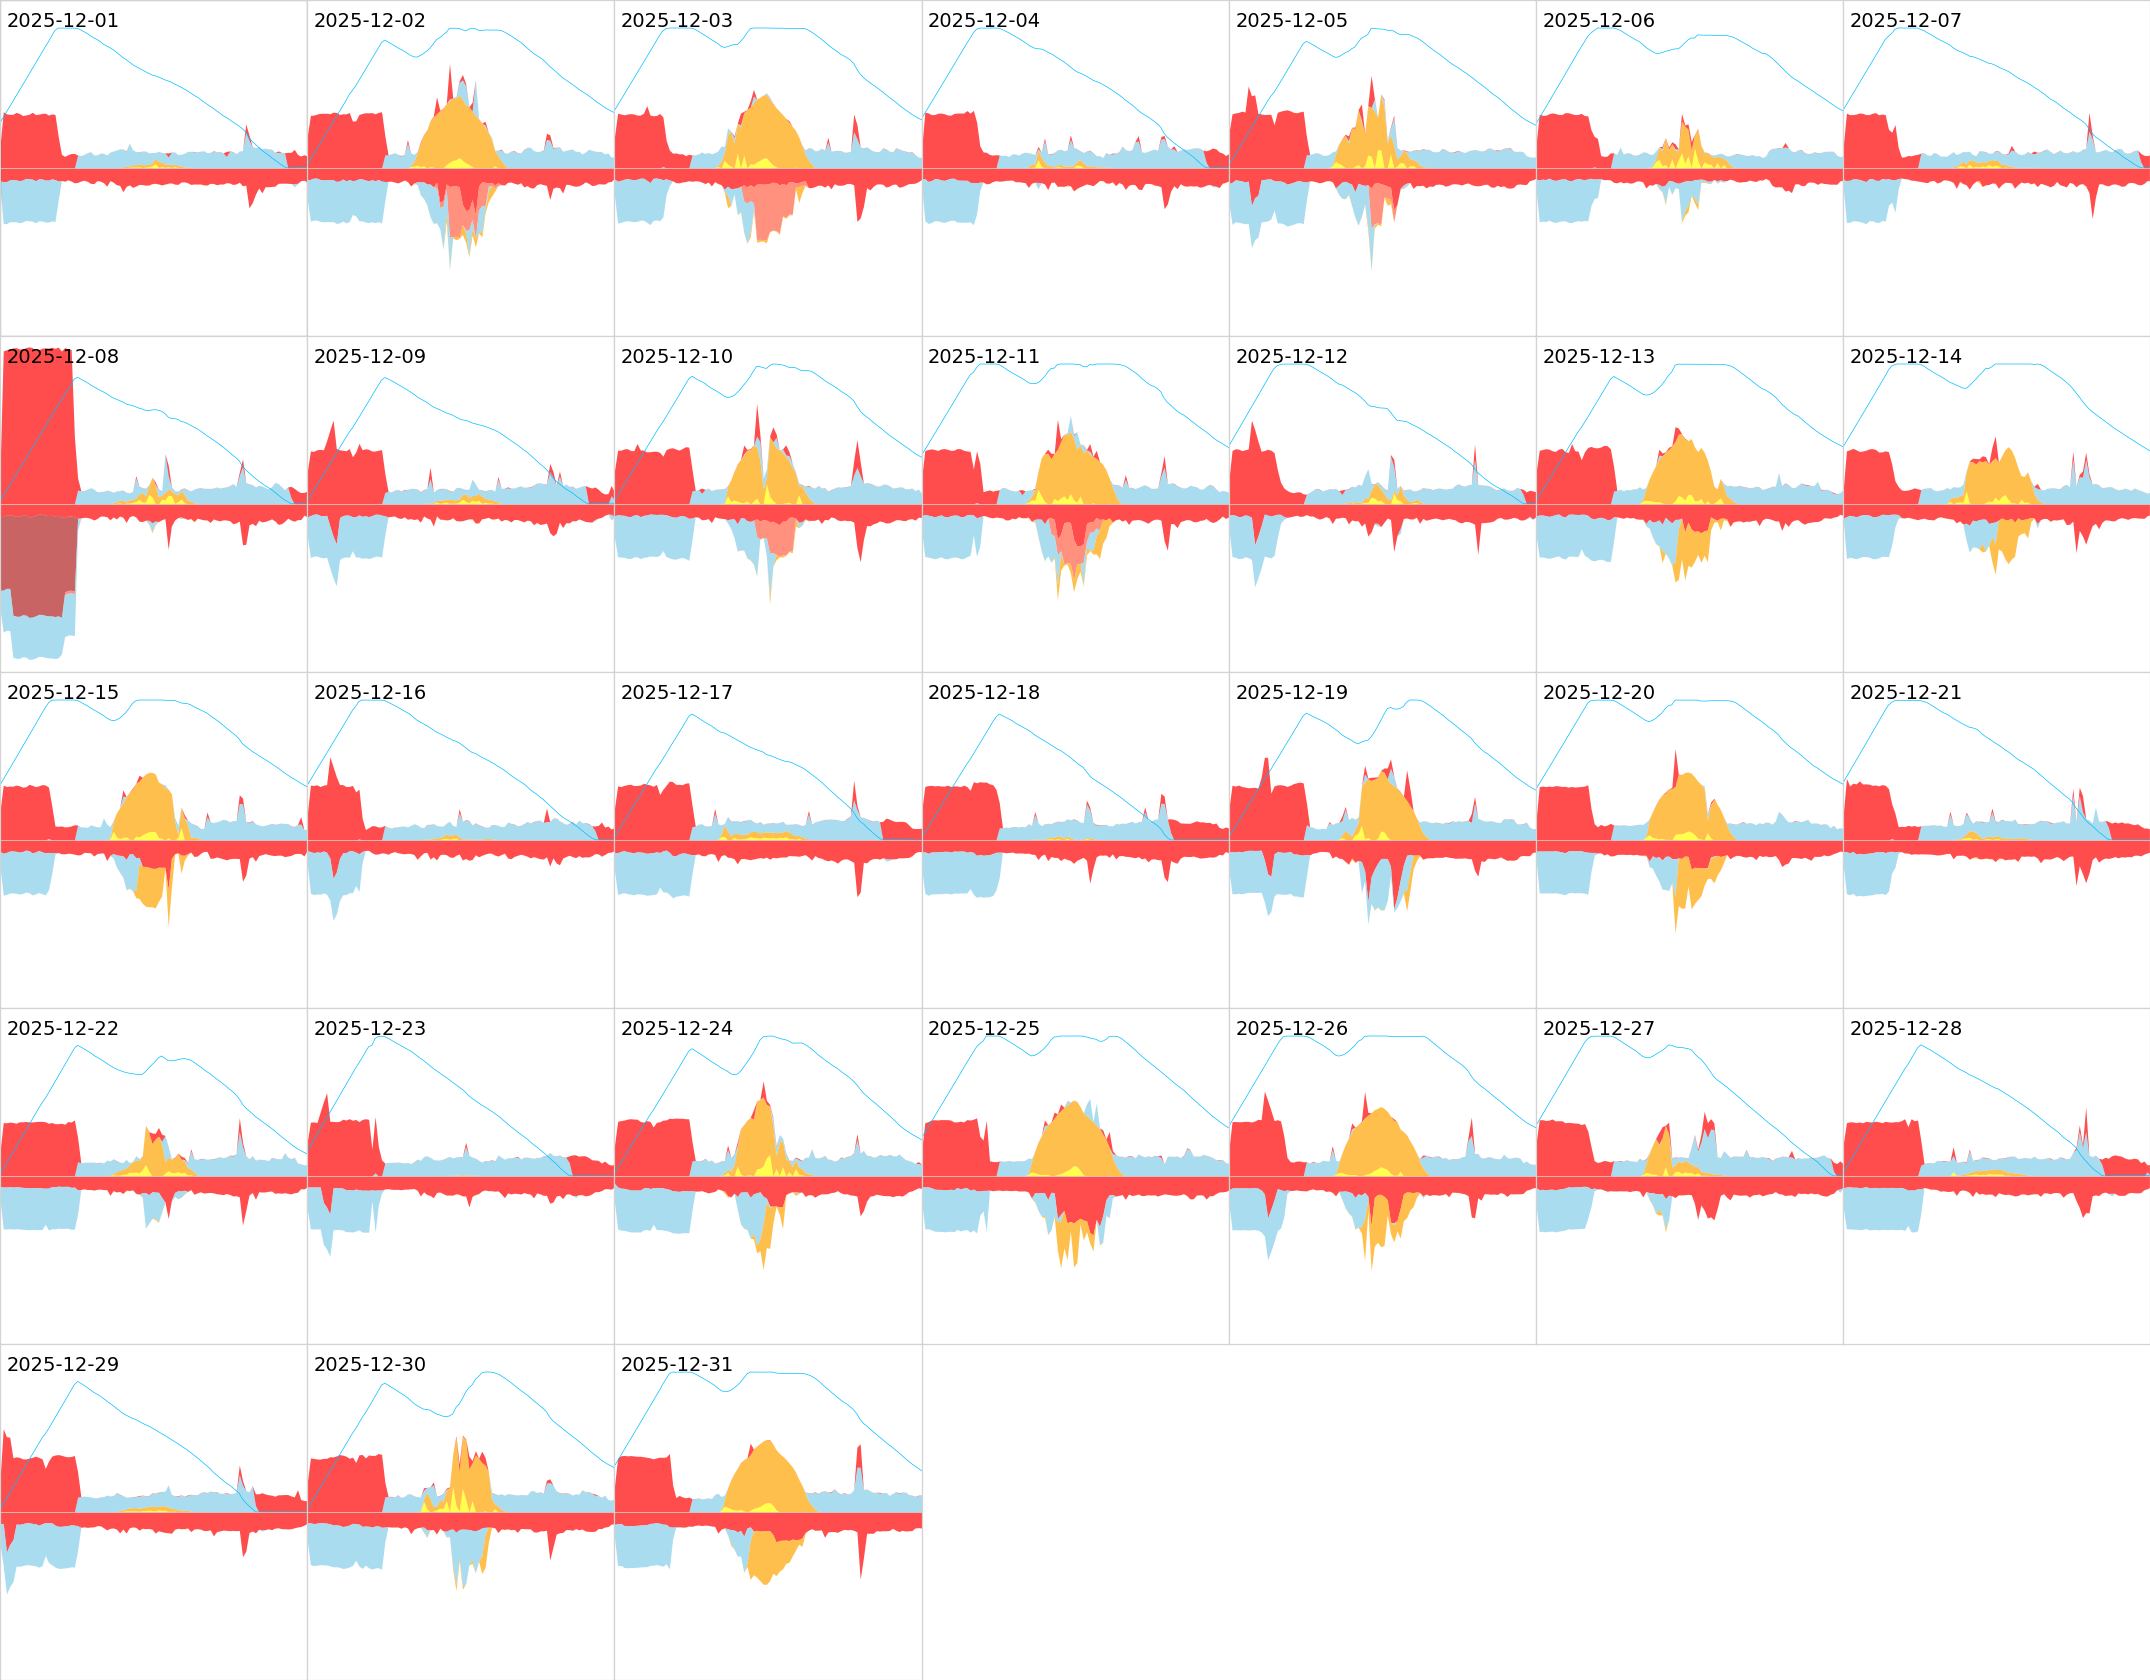
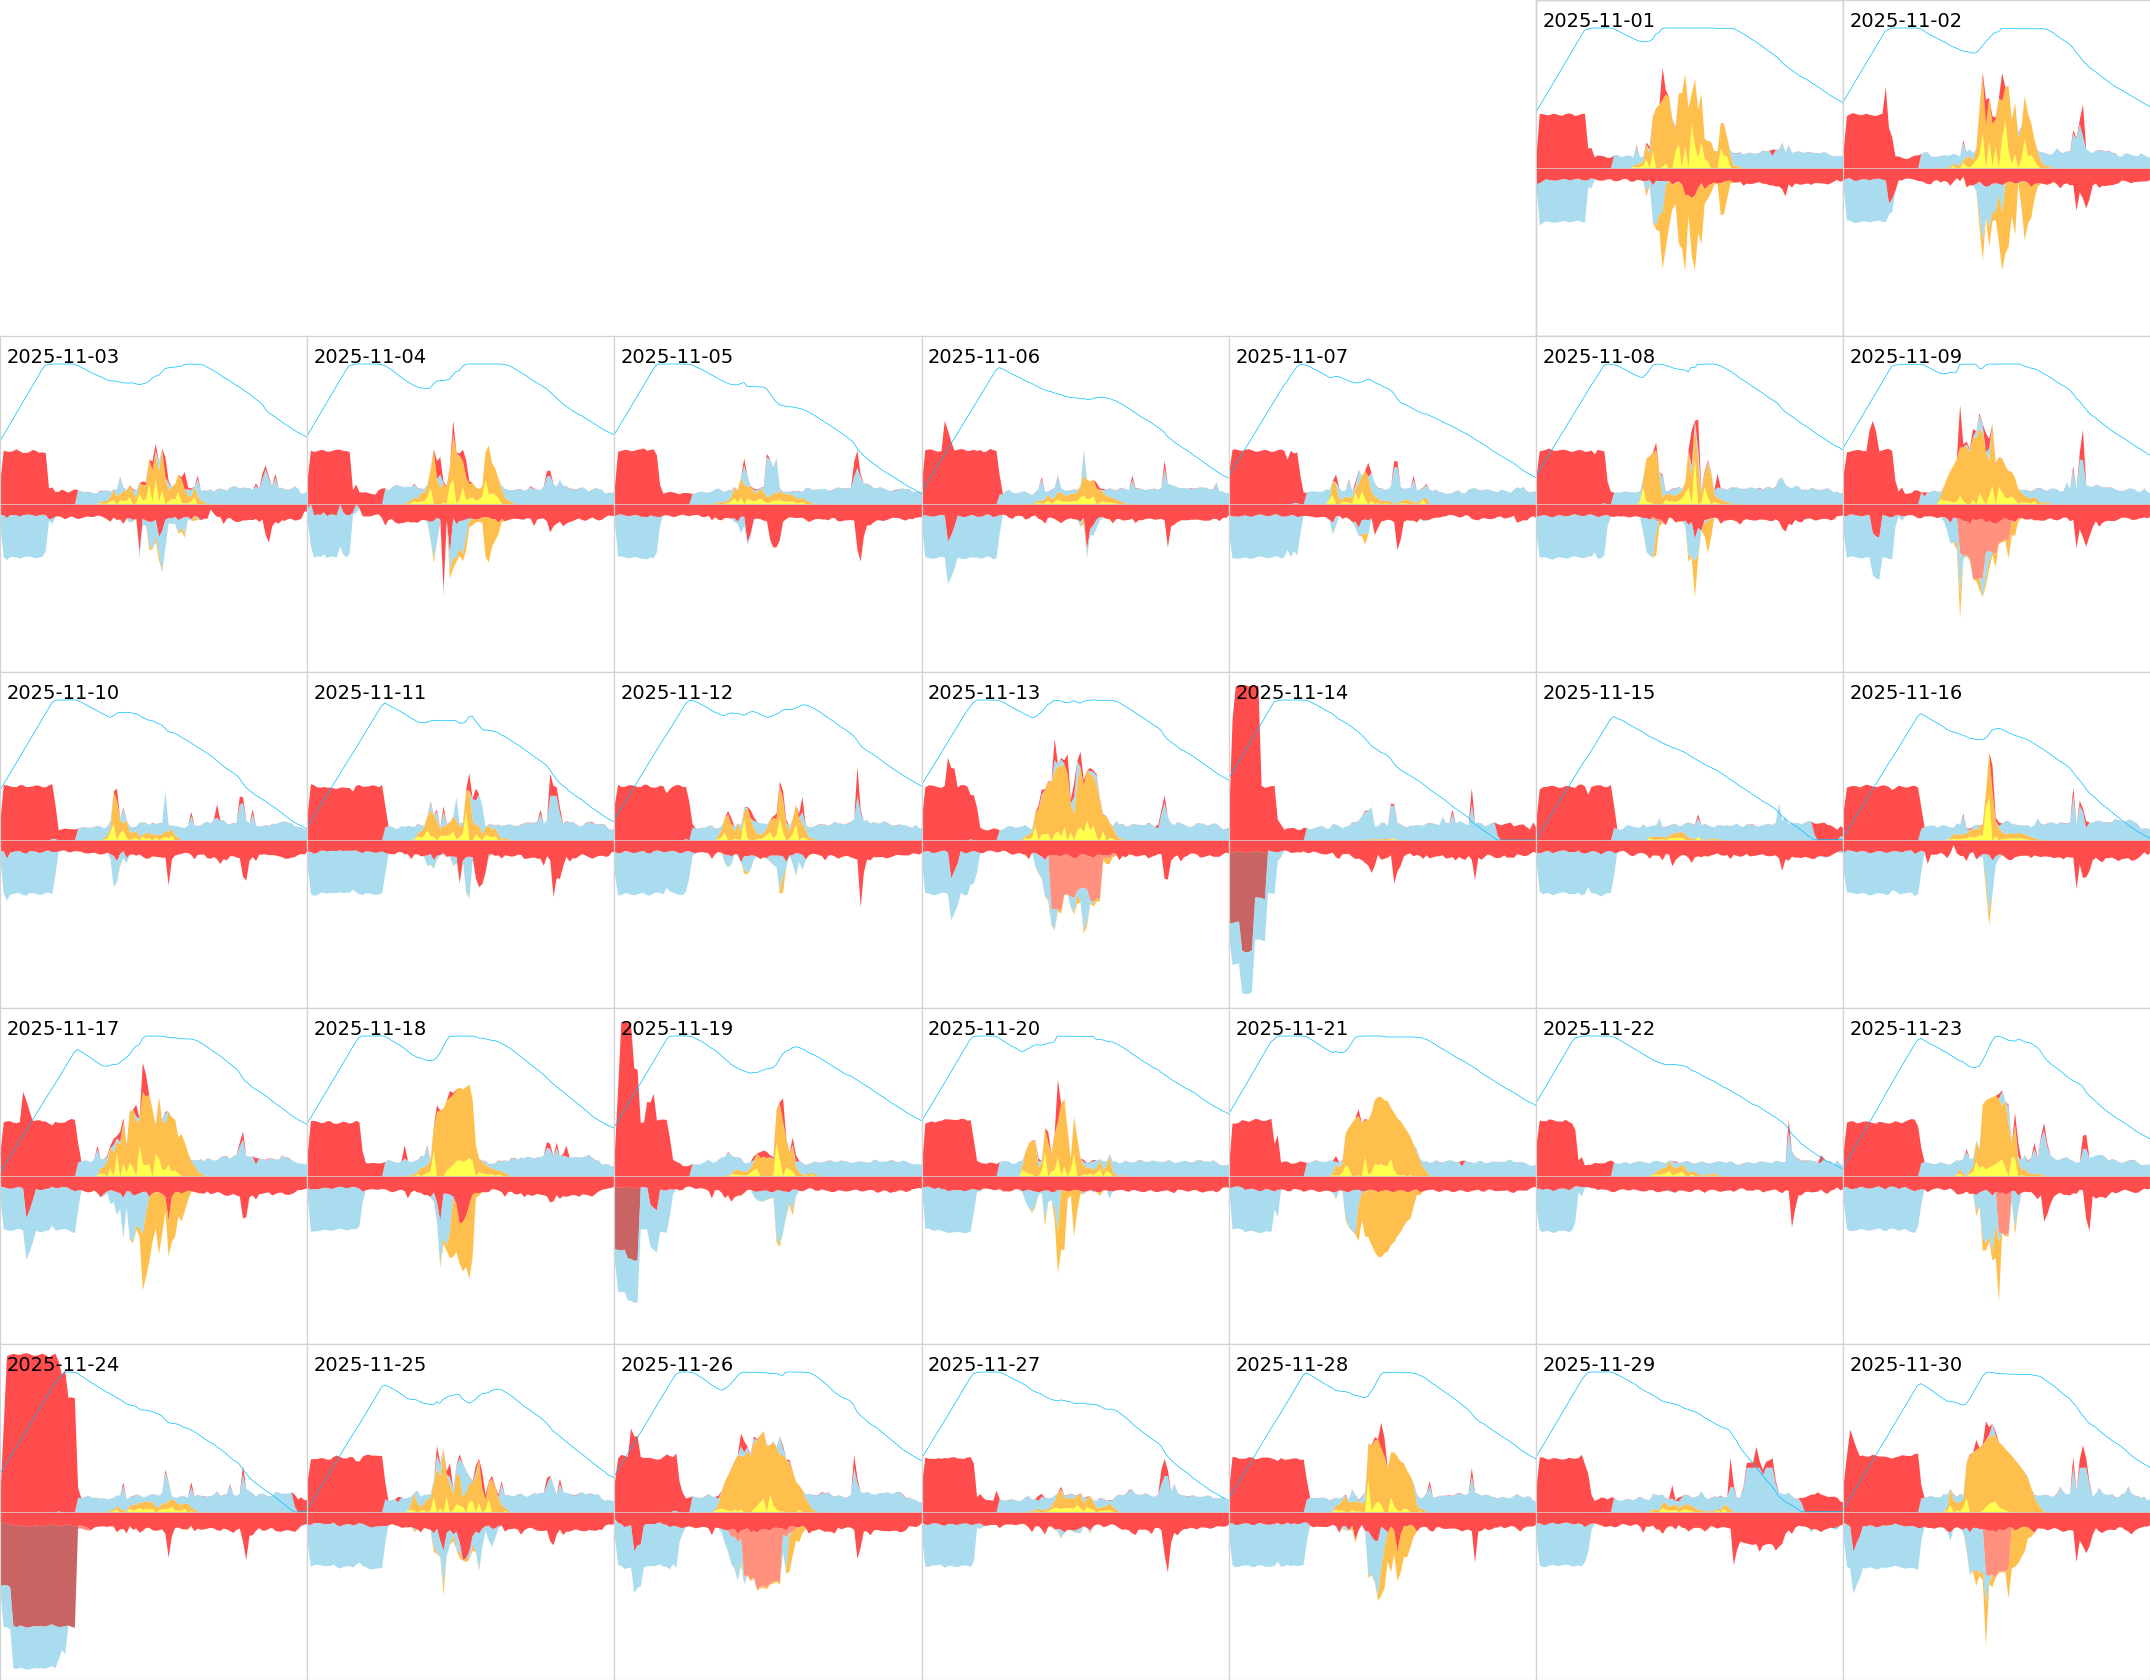
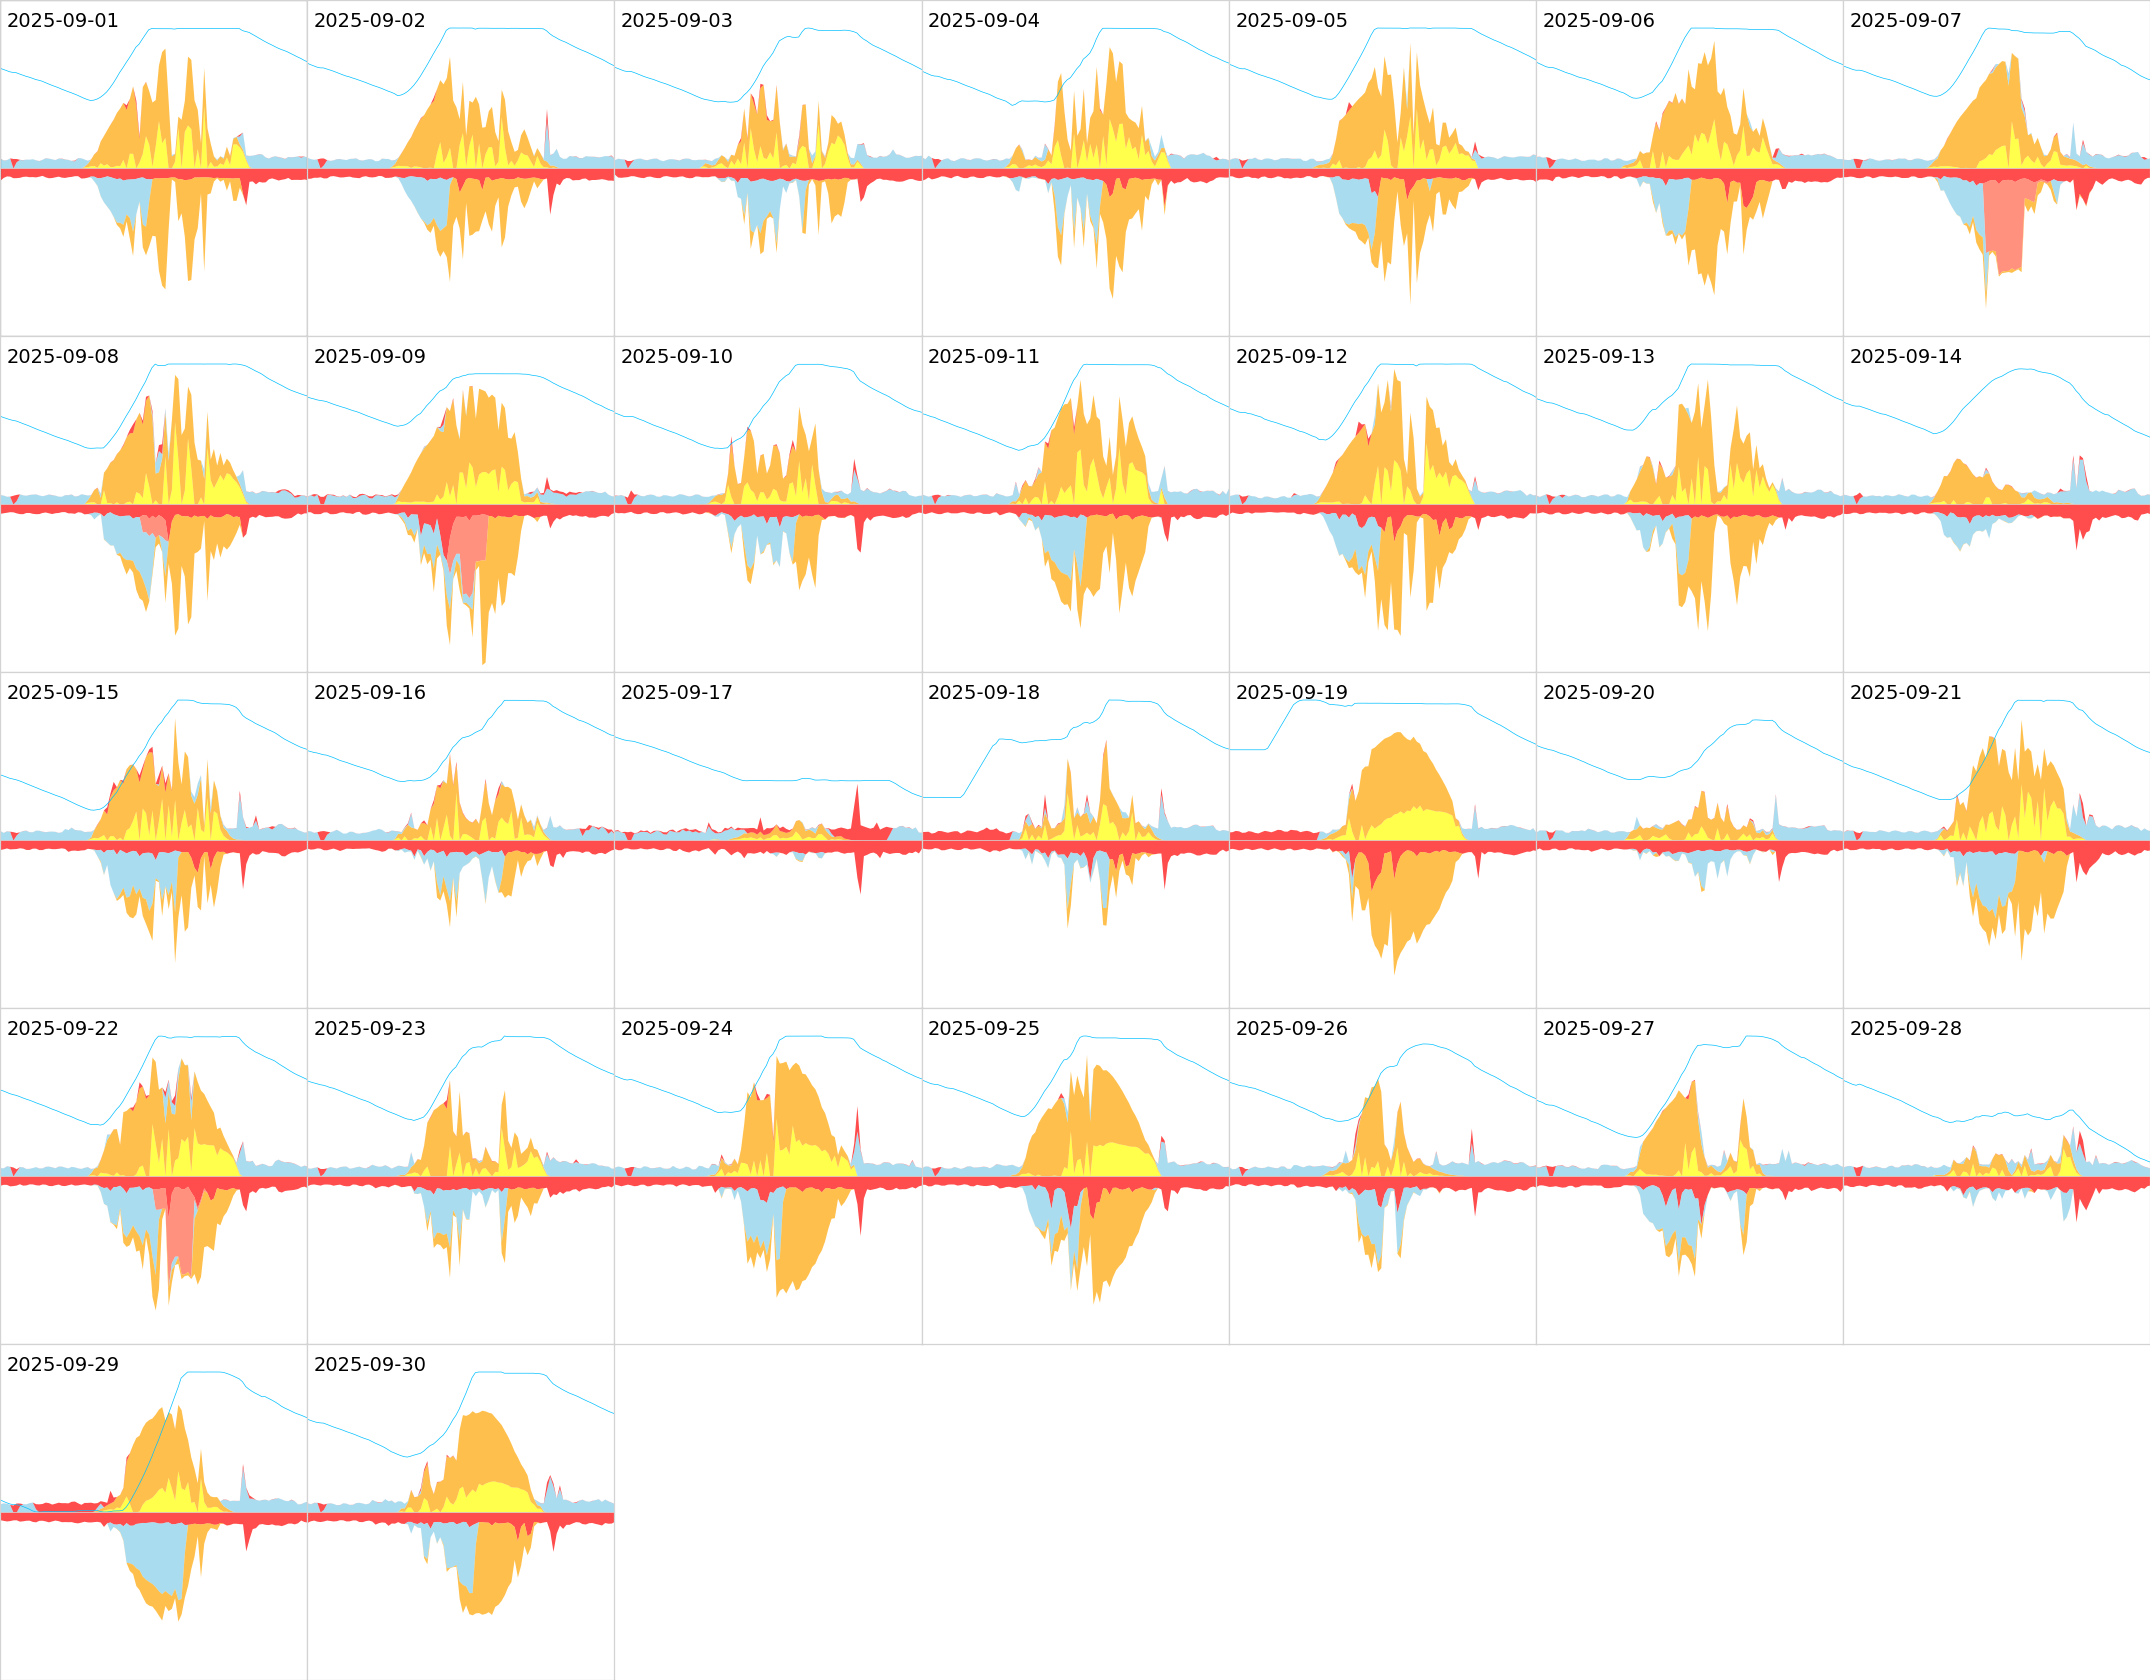
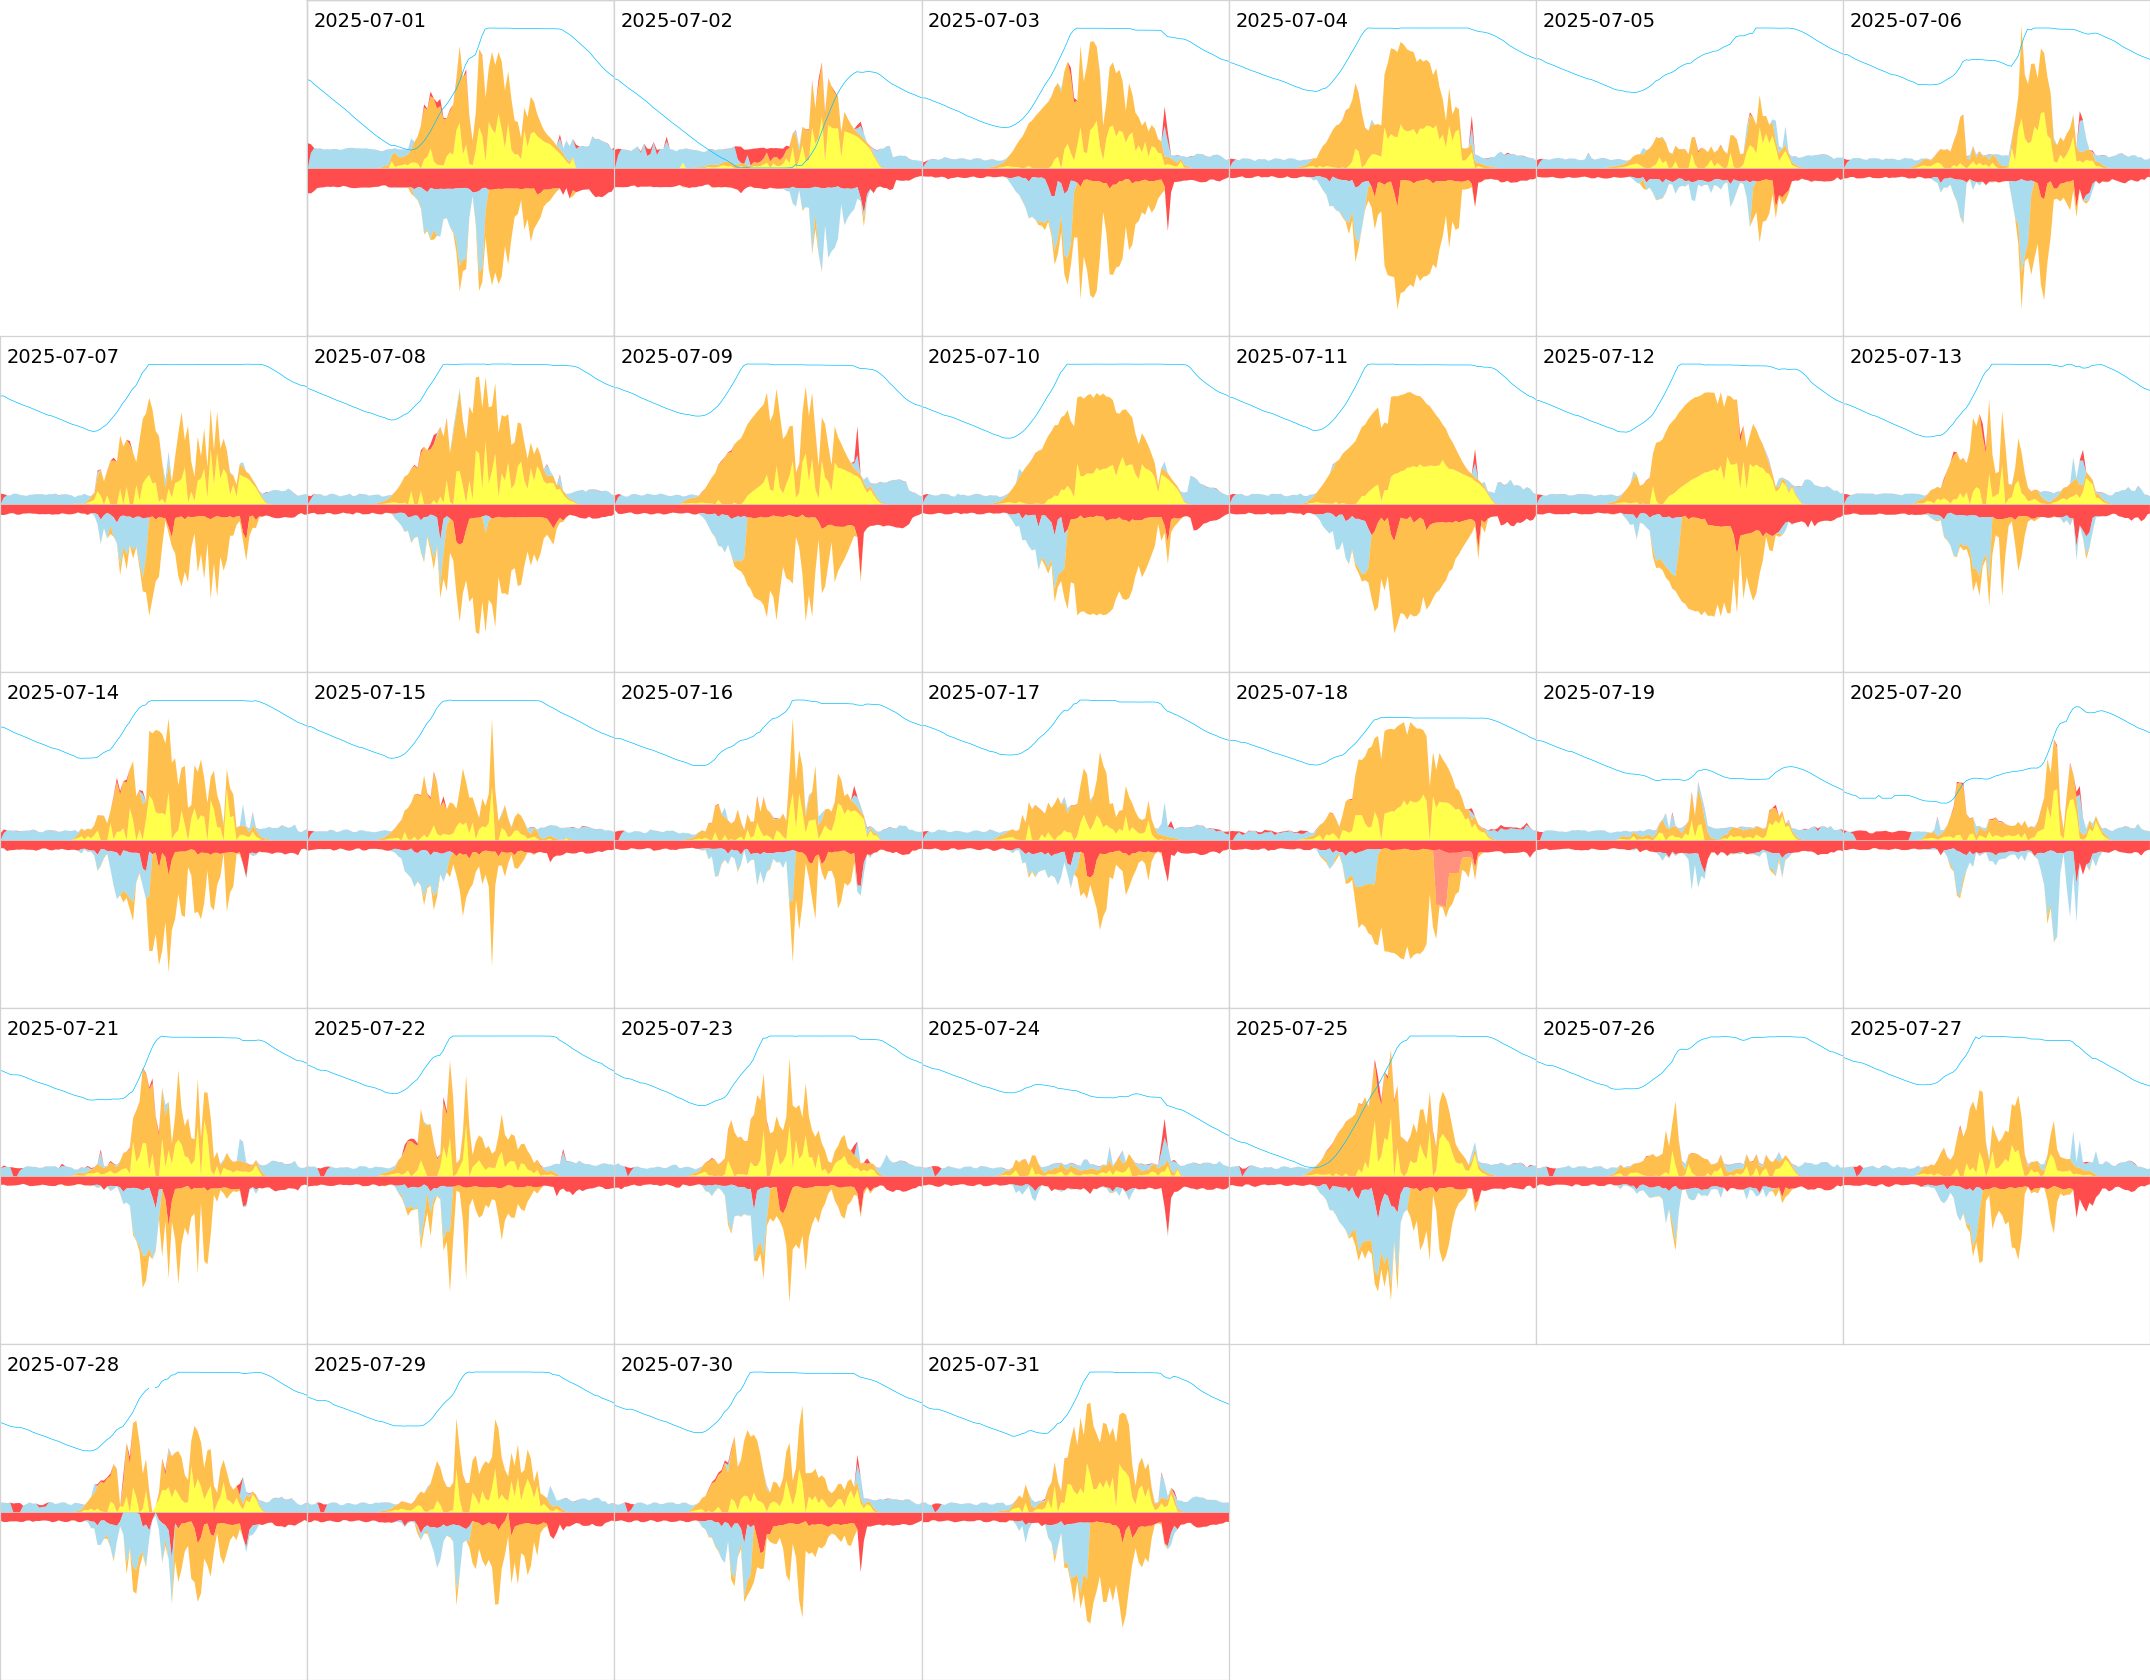
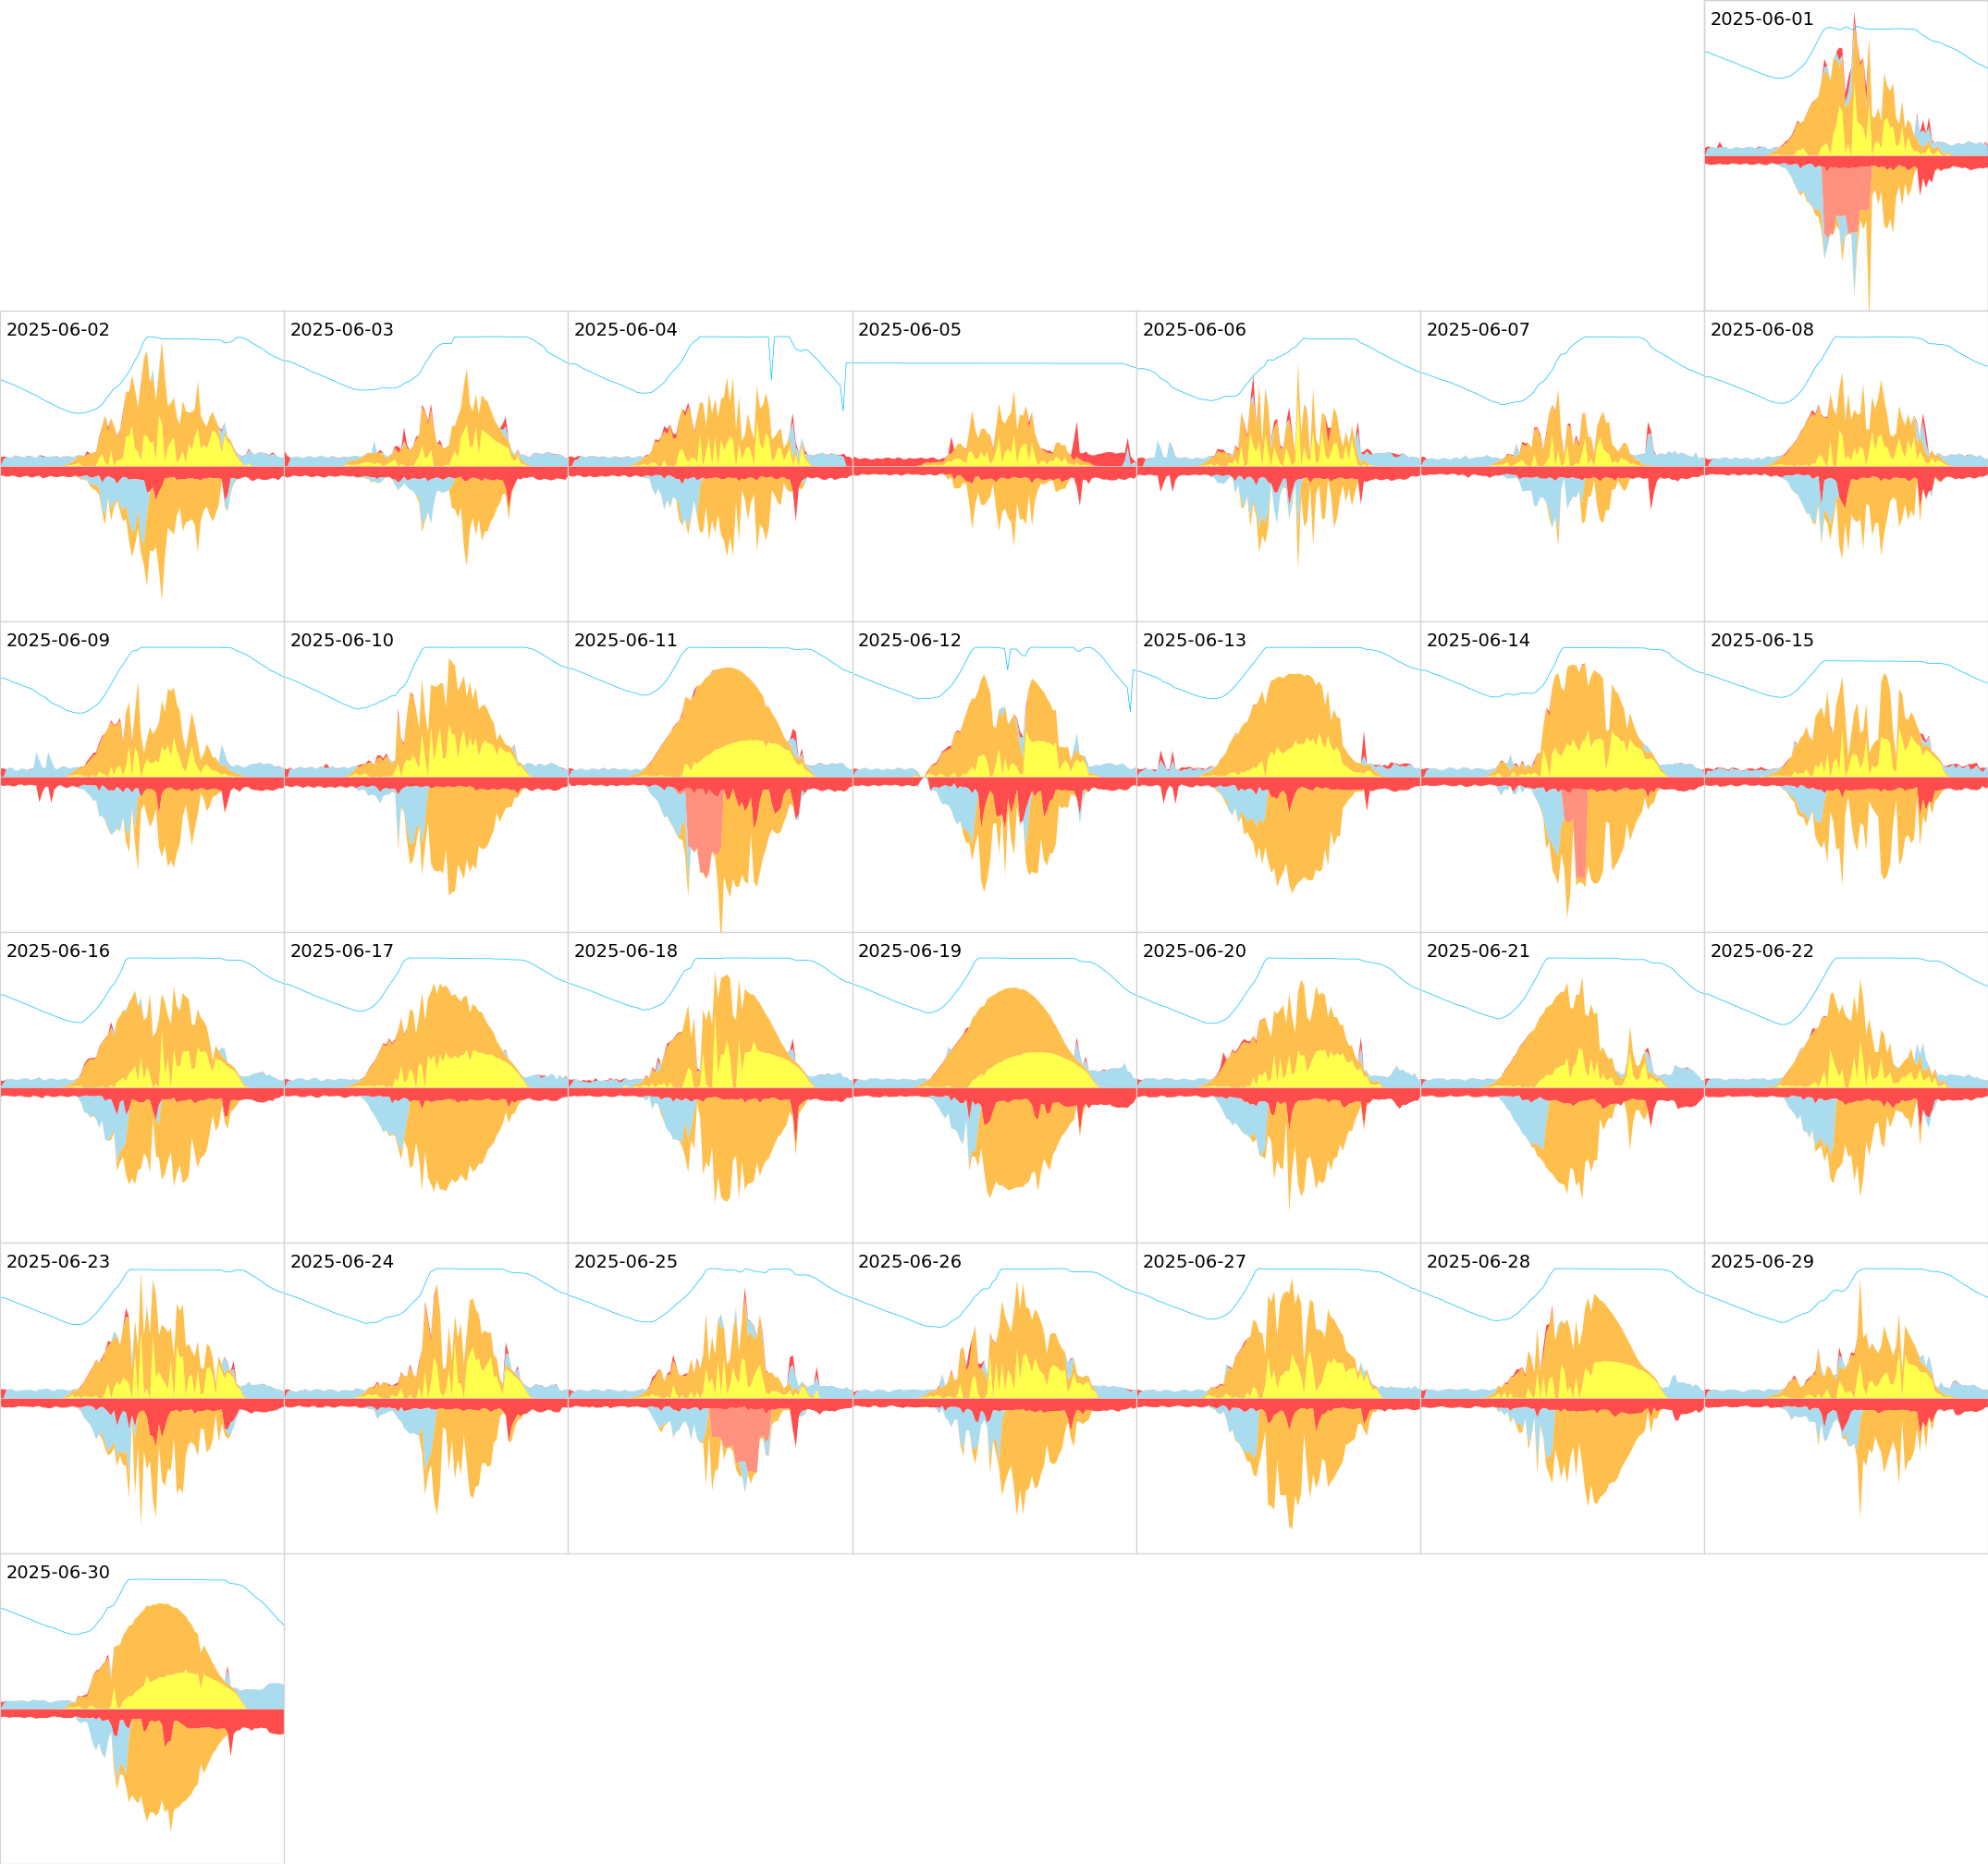
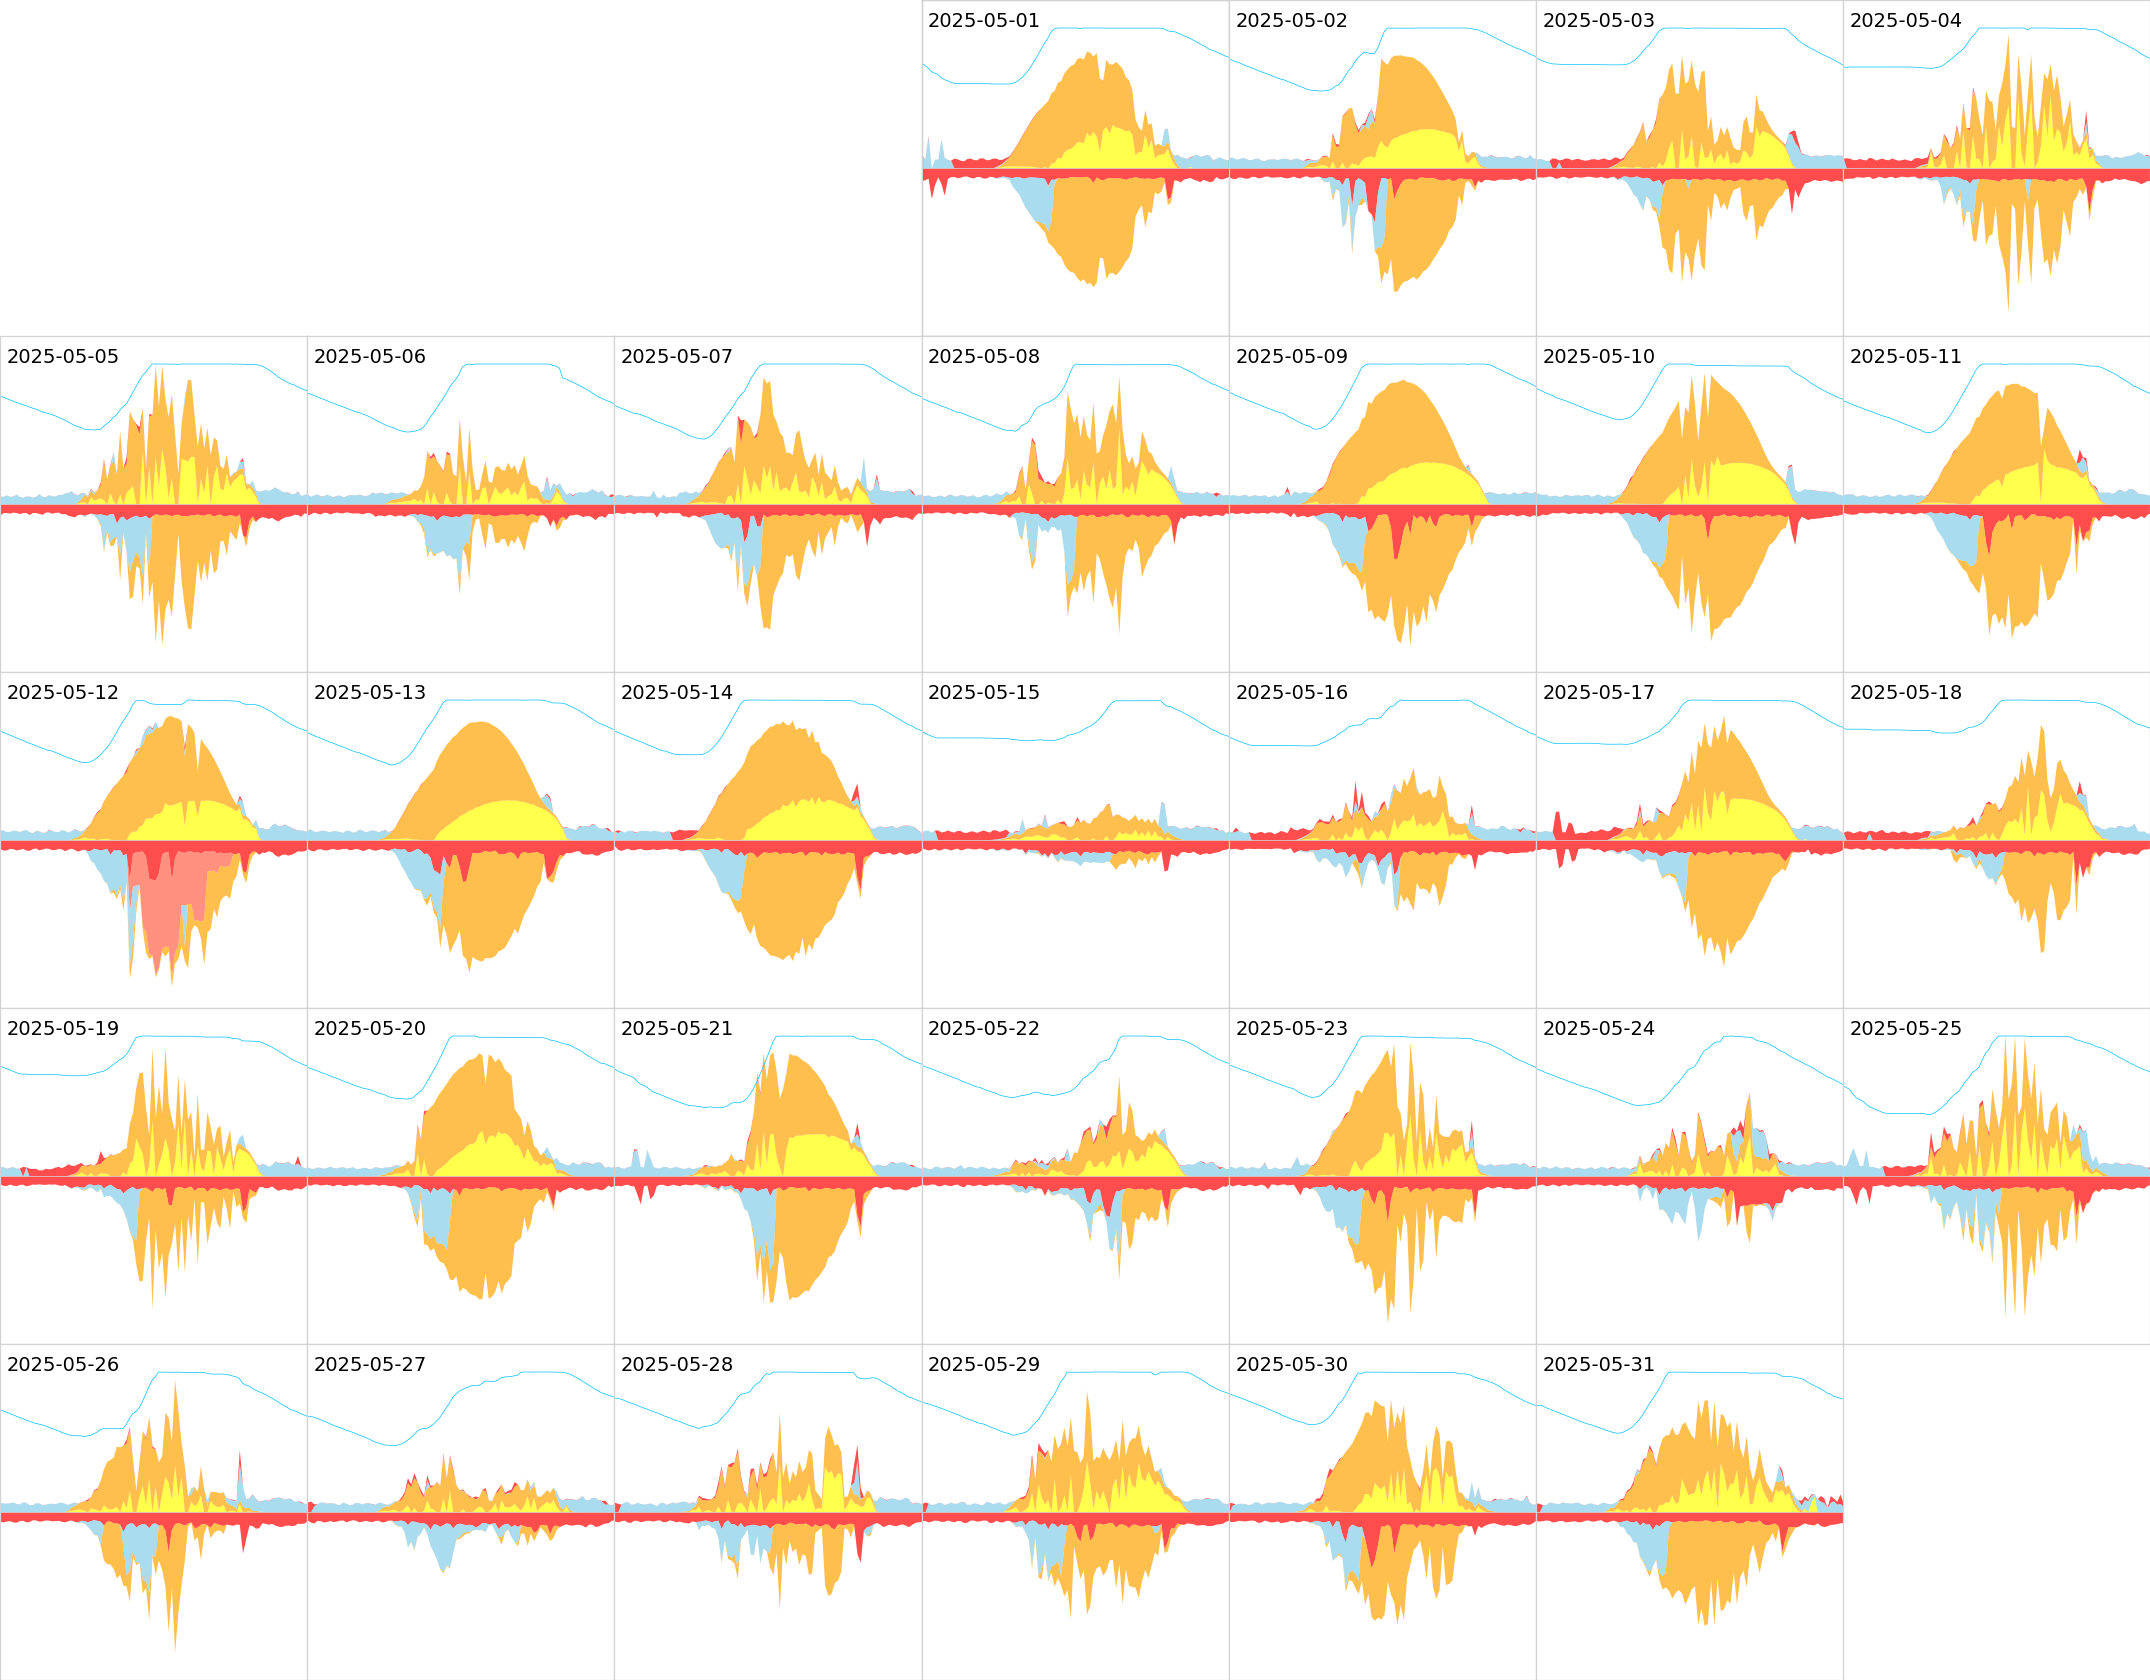
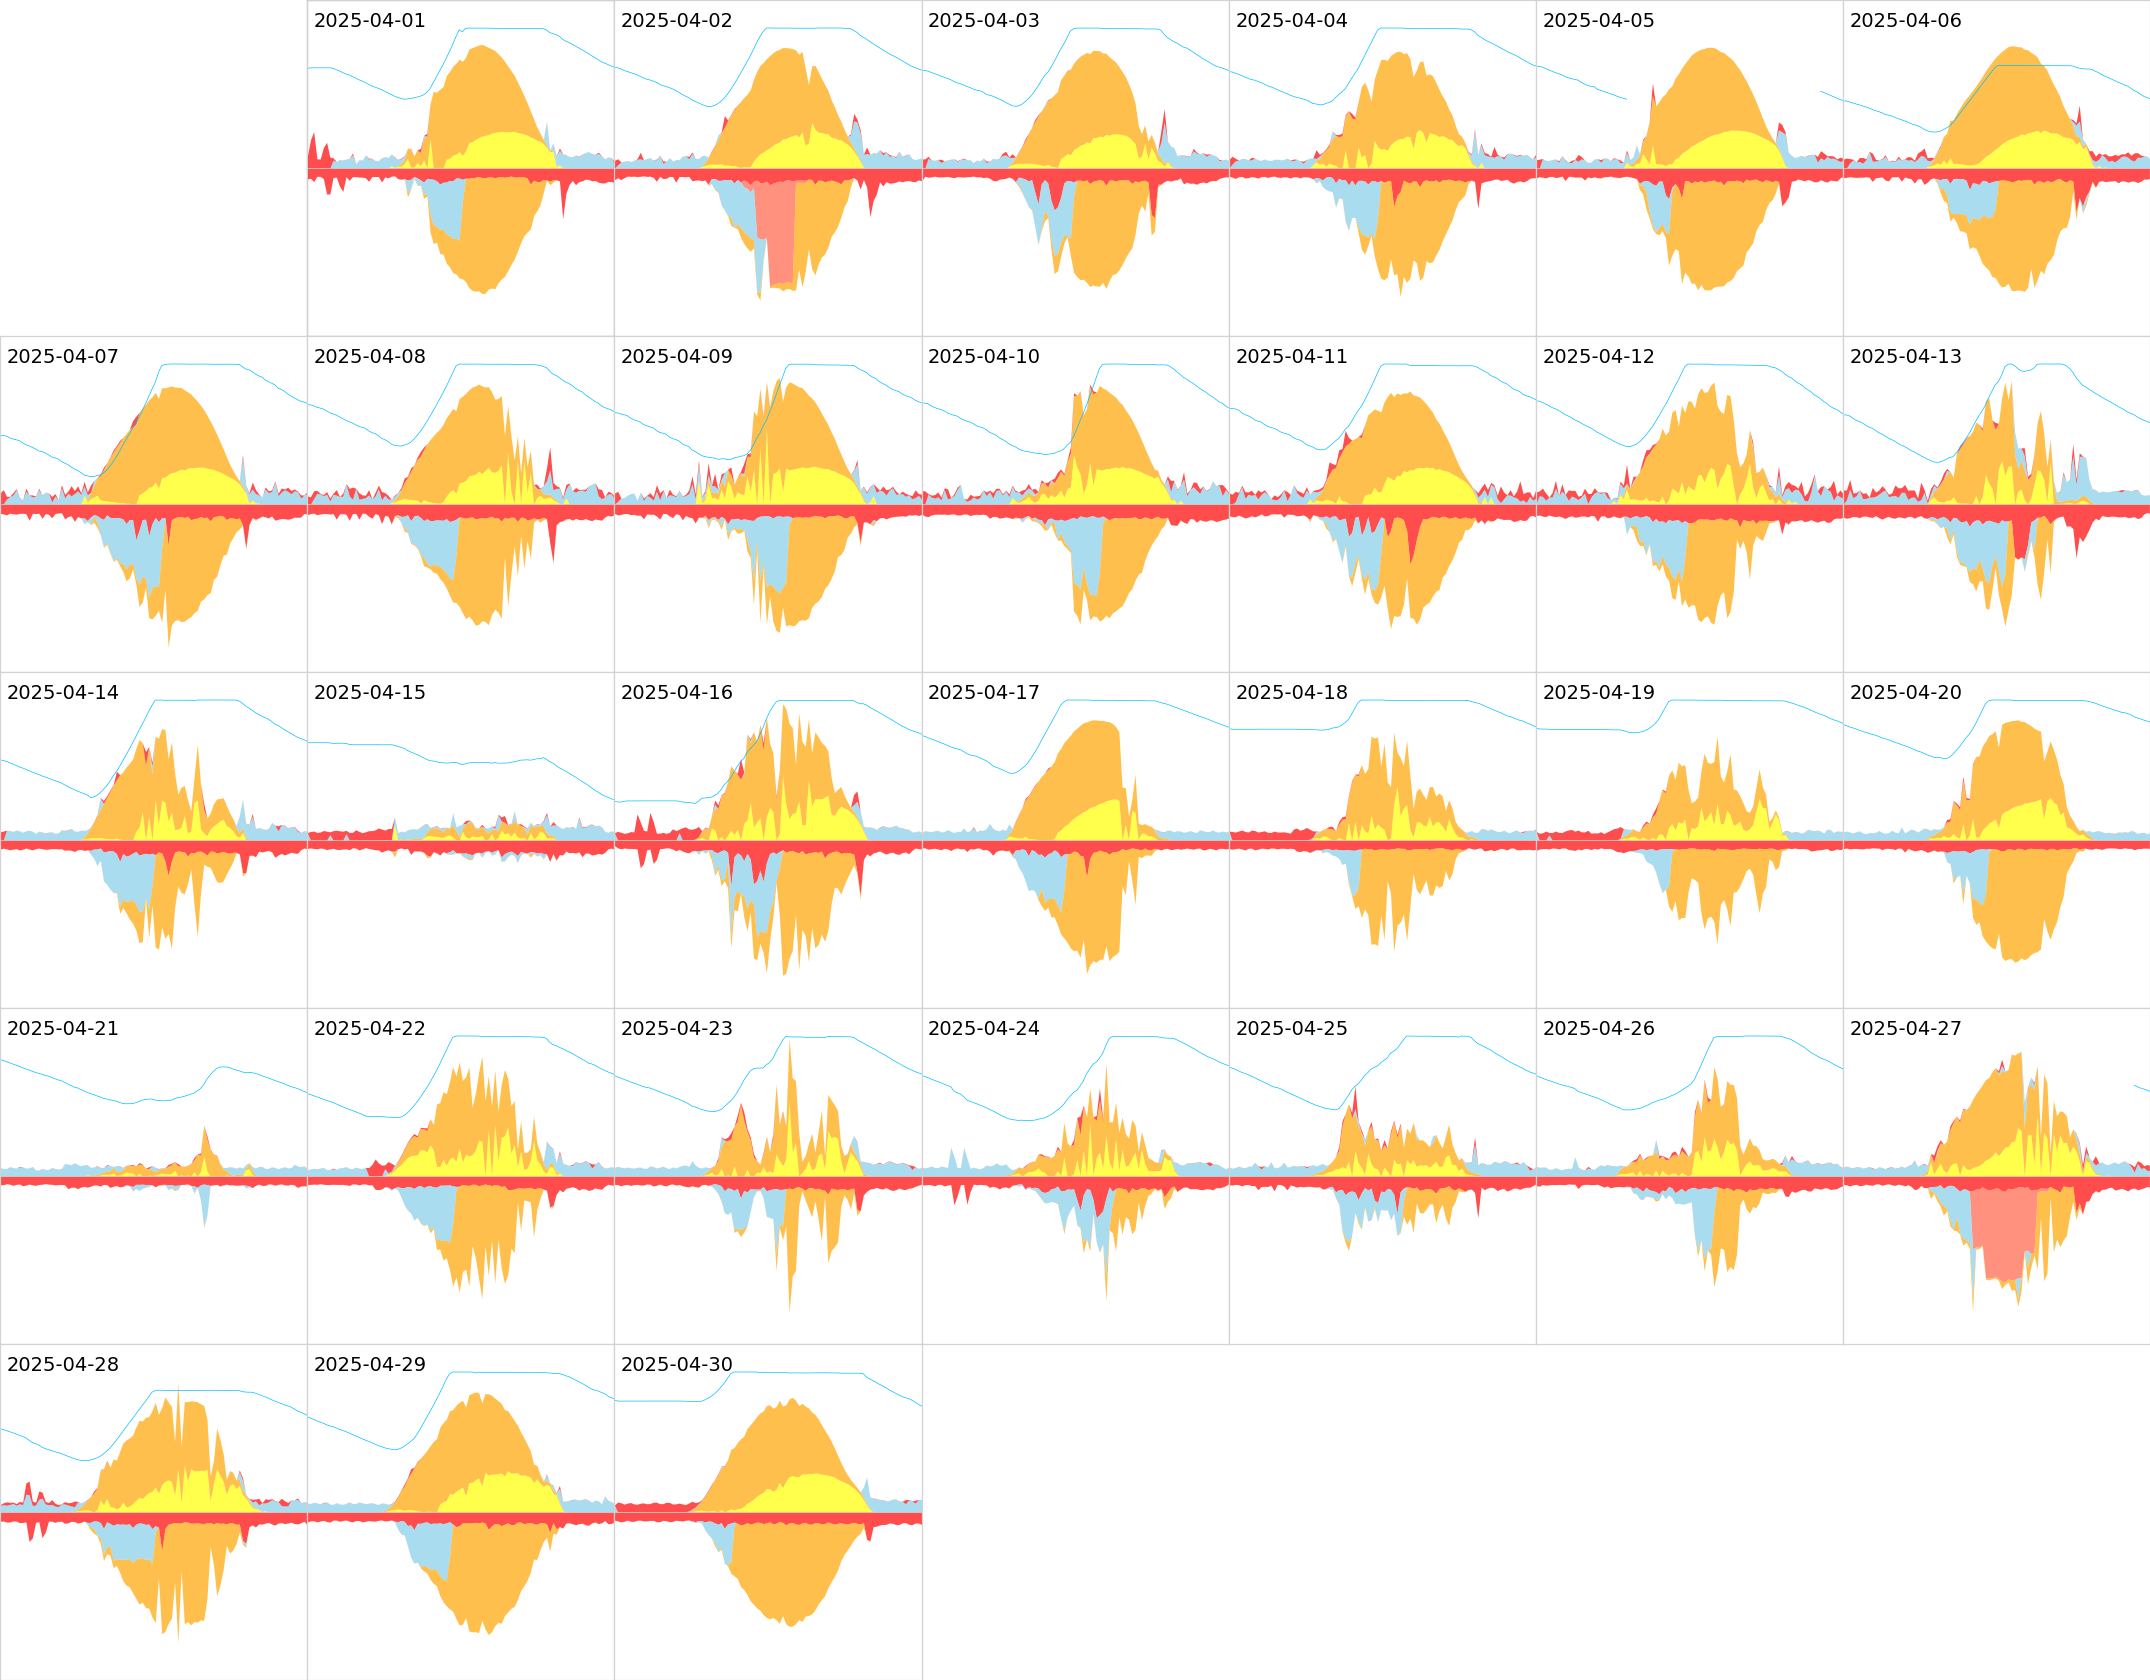
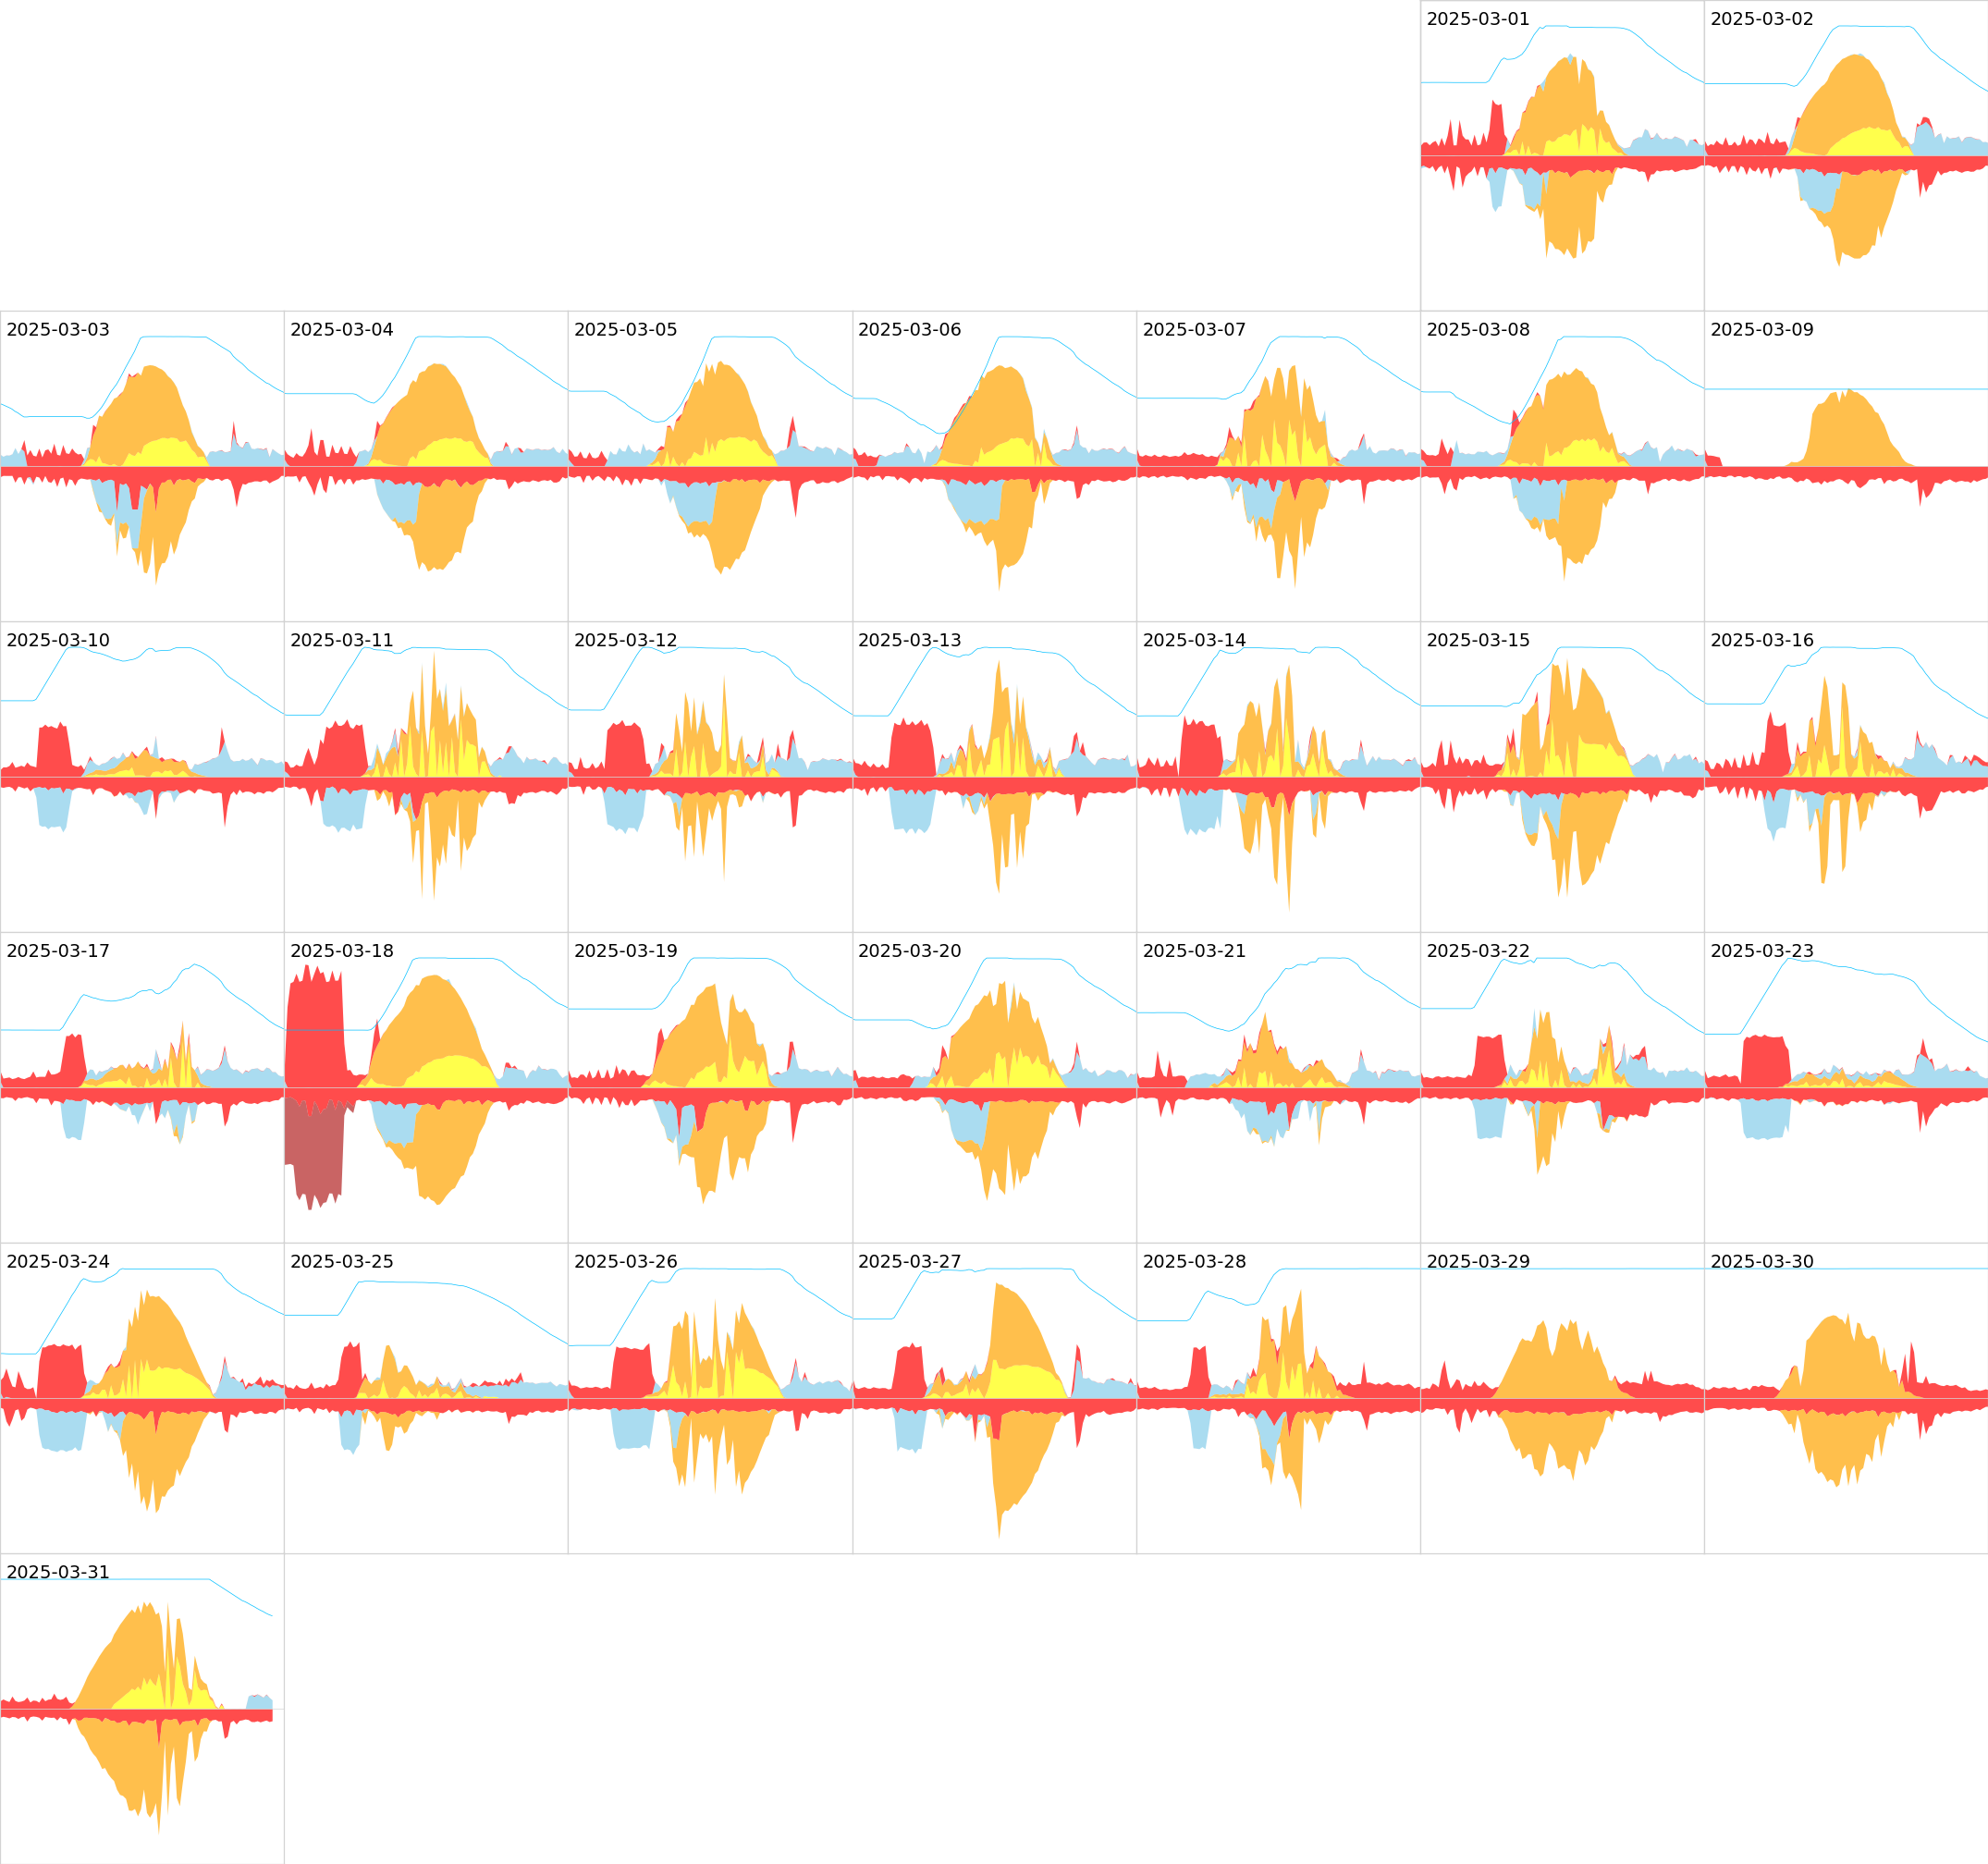
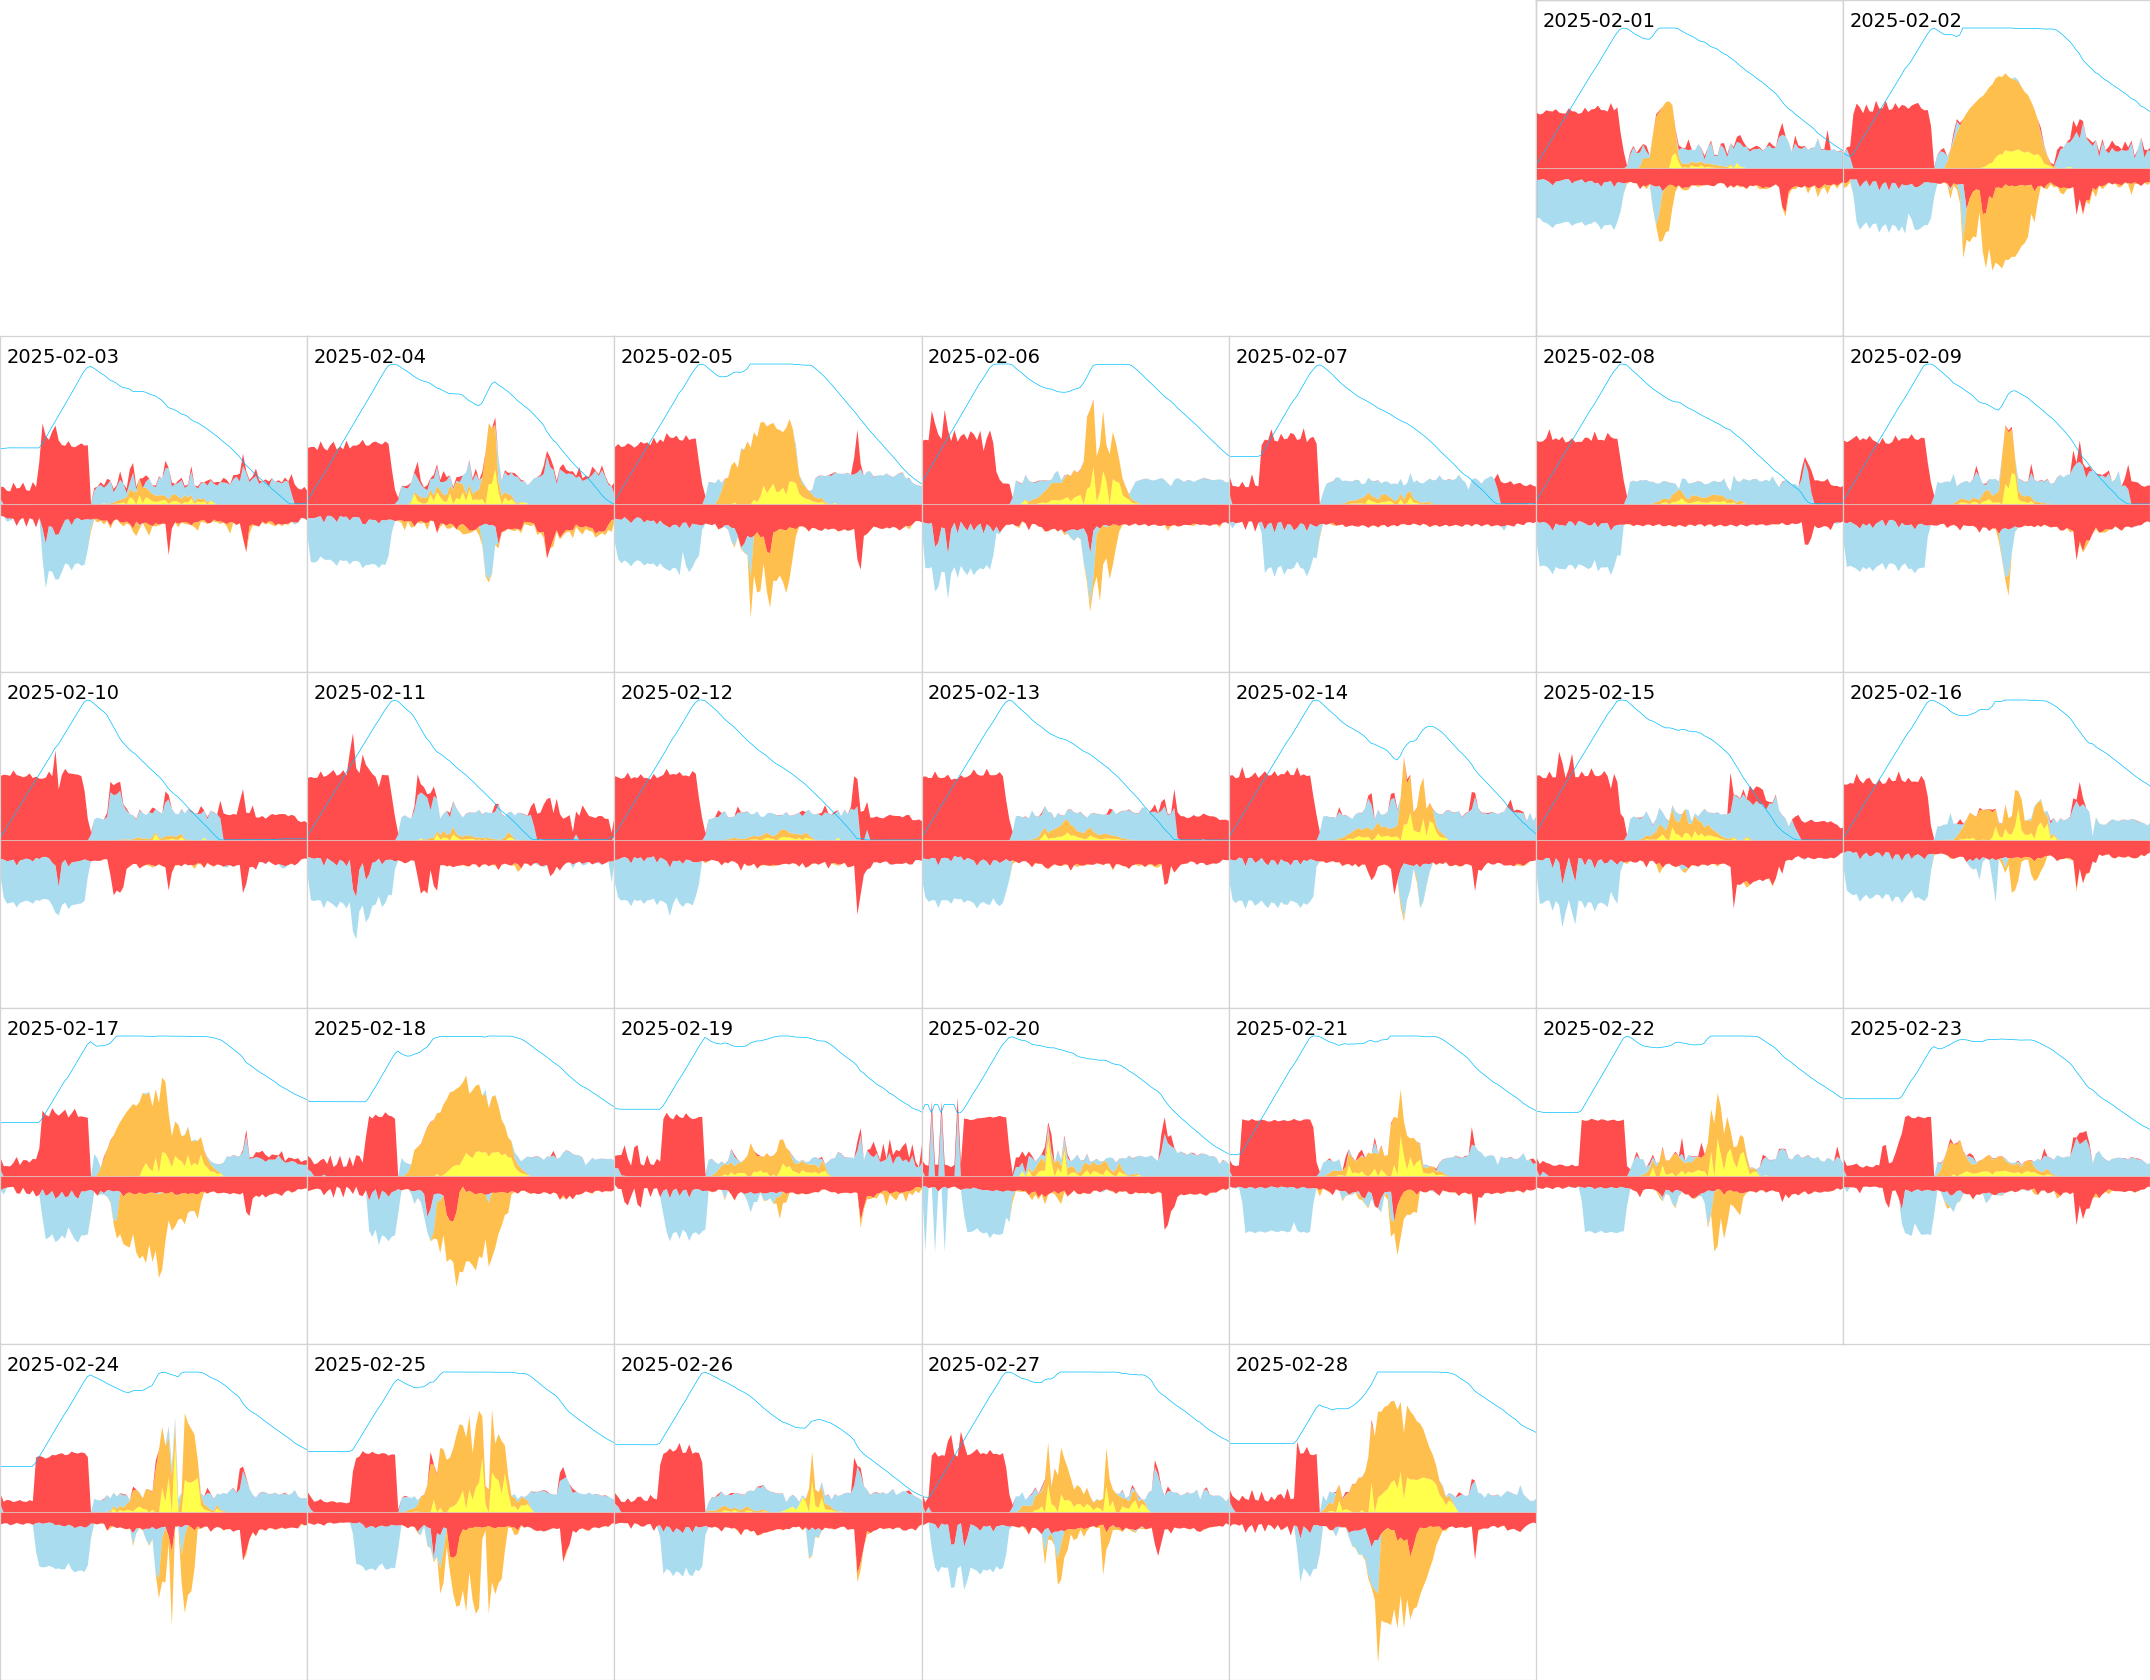
Data is gathered at 5 minute intervals. The horizontal time axis runs from 3:00am to 9:00pm GMT. The vertical axis runs from zero to 8kW. The orange regions indicate the minimum, lower quartile, median, upper quartile, and maximum generation at that time, over the month. The line indicates the actual generation at that time (or the monthly mean, for the monthly average plots). The number in the top right is the total generation in kWh that day (or the monthly mean, for the monthly average plots).
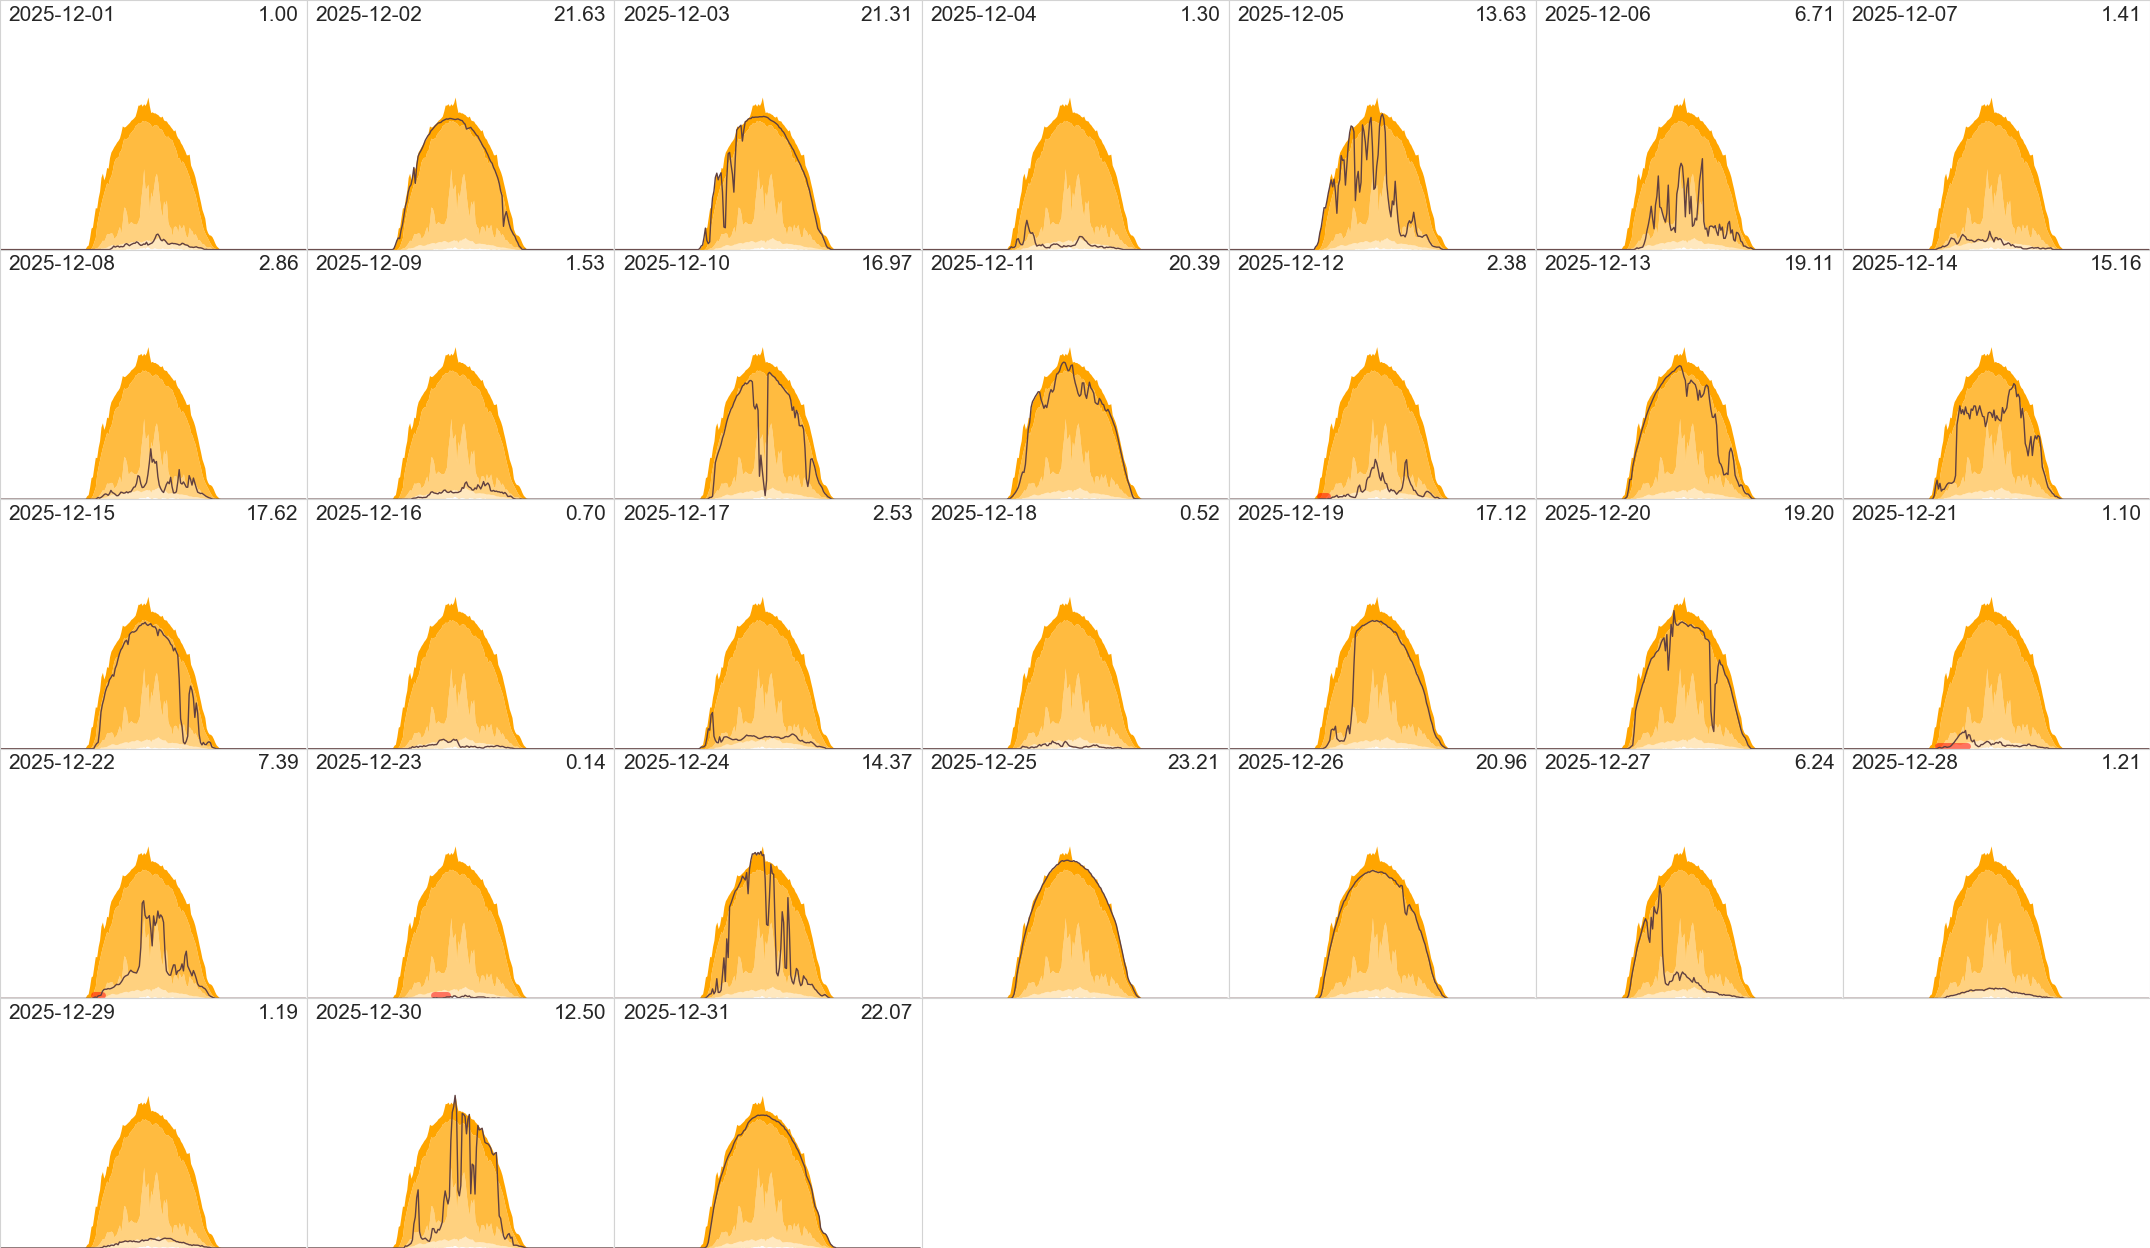
4 Dec the power was off for about an hour as an upgrade to the system was installed that allows us to keep using the battery/PV if there is a power cut. 28 Dec half of the panels stayed off all day (a day of cold, foggy weather: the panels that came on generated hardly anything!). 29 Dec started cold and misty, then got sunnier; half the panels waited until the sun warmed them up before coming on.
On the 5th the solar PV was switched off for about half an hour, while some wiring for the new secondary PV system was adjusted.
On the 18th the solar PV was switched off for about an hour, while the new secondary PV system was wired in. On the 22nd, all power was off for about half an hour while the new storage batteries and Zappi EV charger were wired in to the mains.
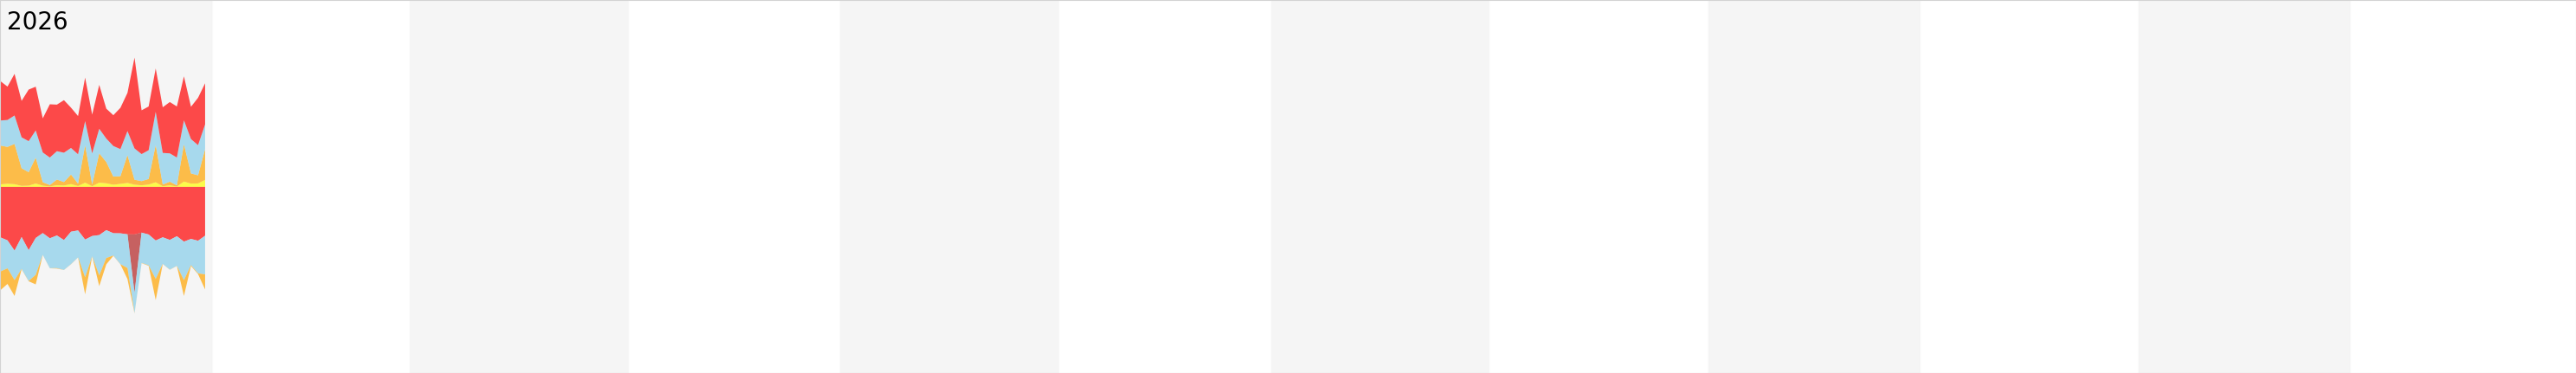
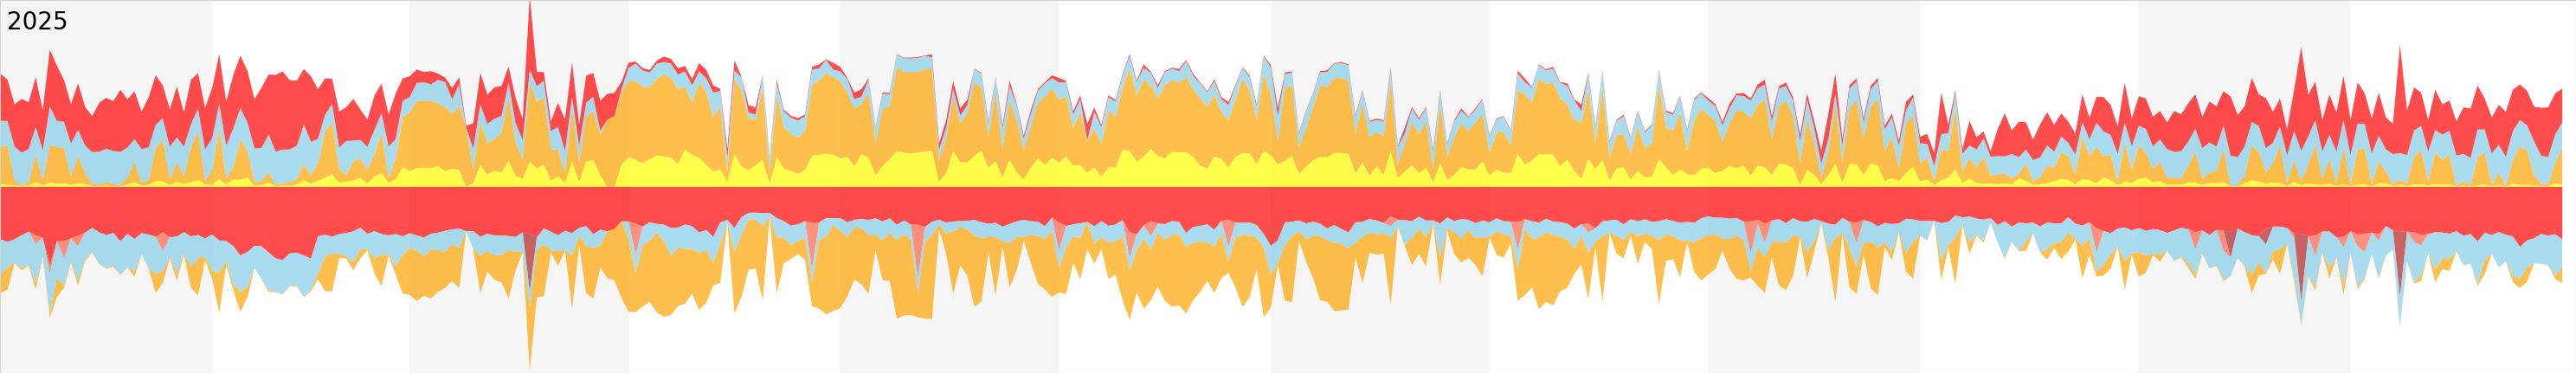
From April 2024, in addition to the 7.6kW PV panels on the house (facing south), we have a further 4kW of PV panels on the garage (facing west), a 20kWh battery, and a 7kW car charger. The data from all this is quite complex; the charts below show the following daily stats:
Input and output should balance: the total power above and below the axis should be mirrored. Any small differences are due to data being gathered from three different sources at three different temporal resolutions.
We are on an EV tariff, so grid electricity is cheaper between midnight and 7am than during the day. So the aim is to use the battery during the day: firstly charging it from excess PV, then charging overnight as necessary. Perfect usage would have no red above the axis between 7am and midnight, but occasionally the battery goes flat before midnight: the “AI” deciding how much to charge it isn’t that clever.

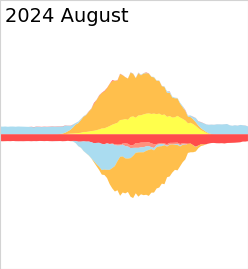
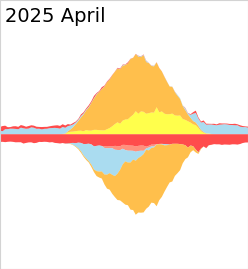
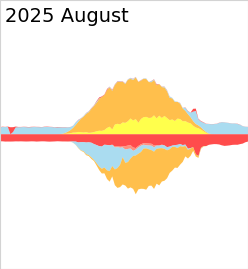
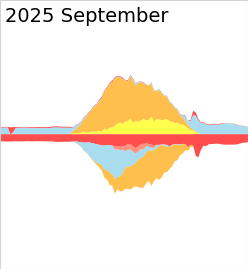
If we rely on the automatic system, or continually try to adjust overnight usage and charging by hand, it or we sometimes get it wrong, and than we end up having to pay for expensive daytime imported power (currently 24.2p/kWh). So instead, we decided mid month just to charge the battery (and car) overnight. This results in us now exporting more generation during the day (for which we are paid 15p/kWh), and importing more from the grid during the night (for which we are currently charged 6.4p/kWh). So as well as being a simpler protocol, it is also more cost-effective.
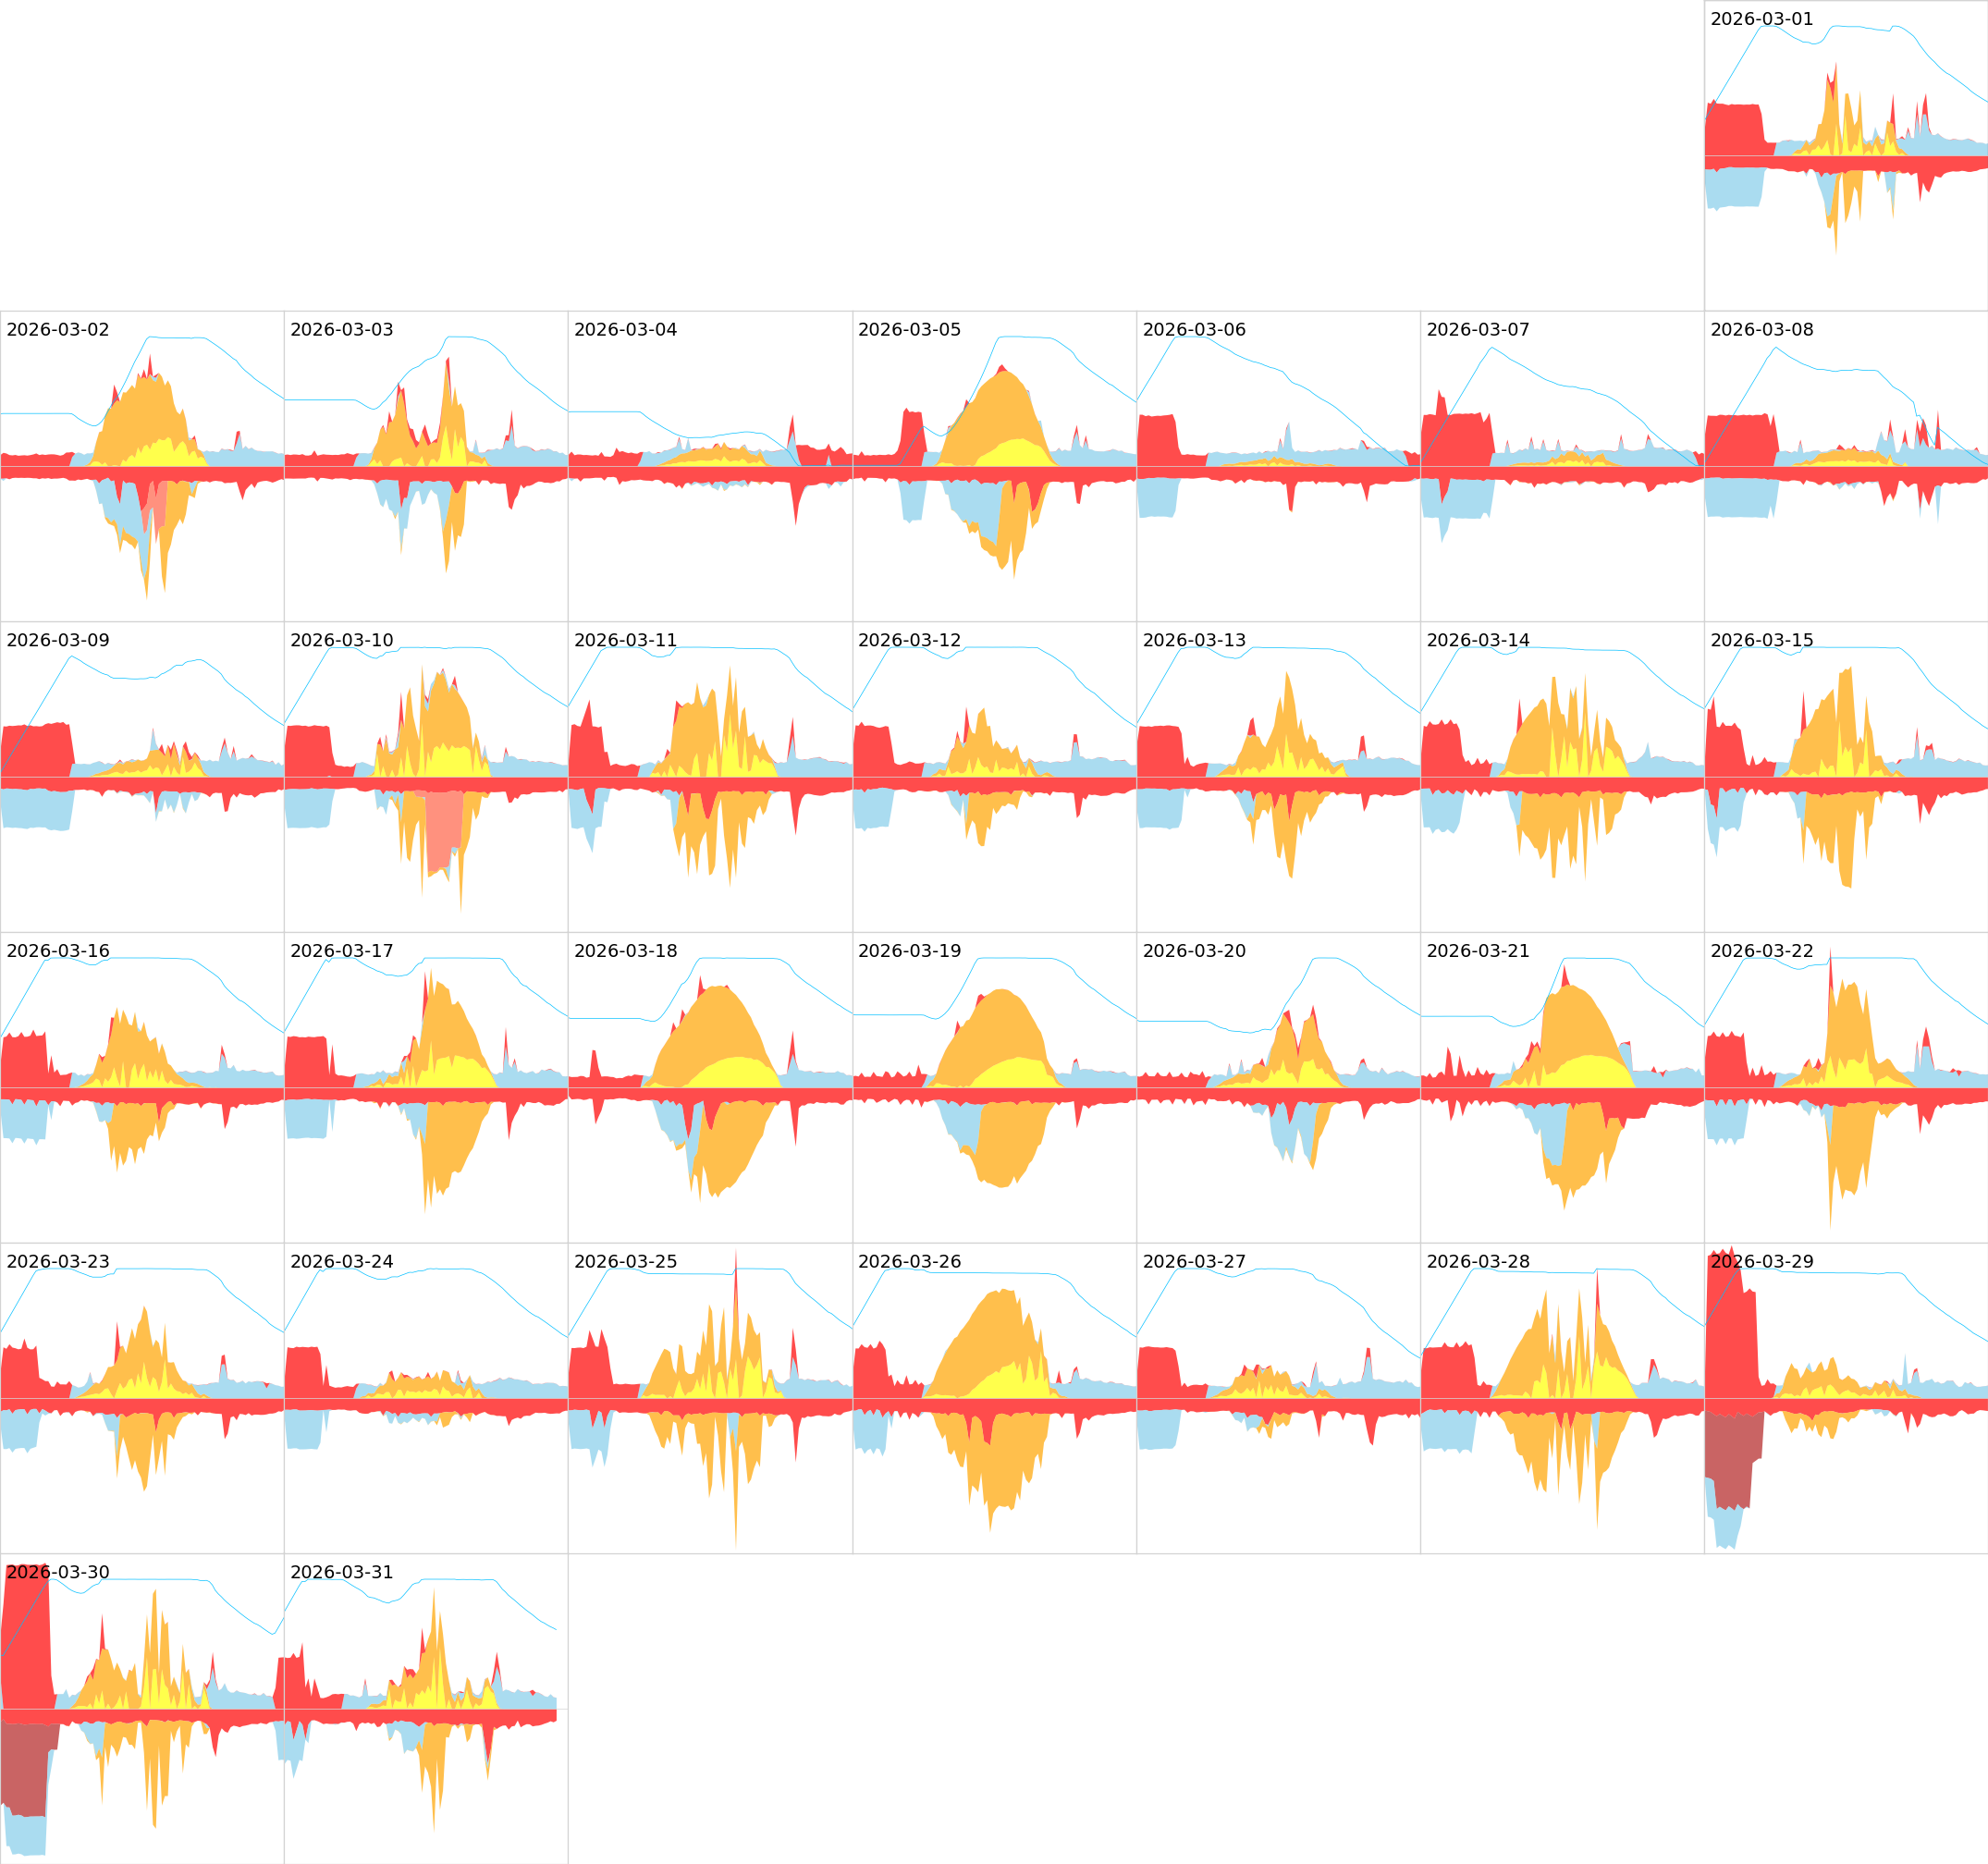
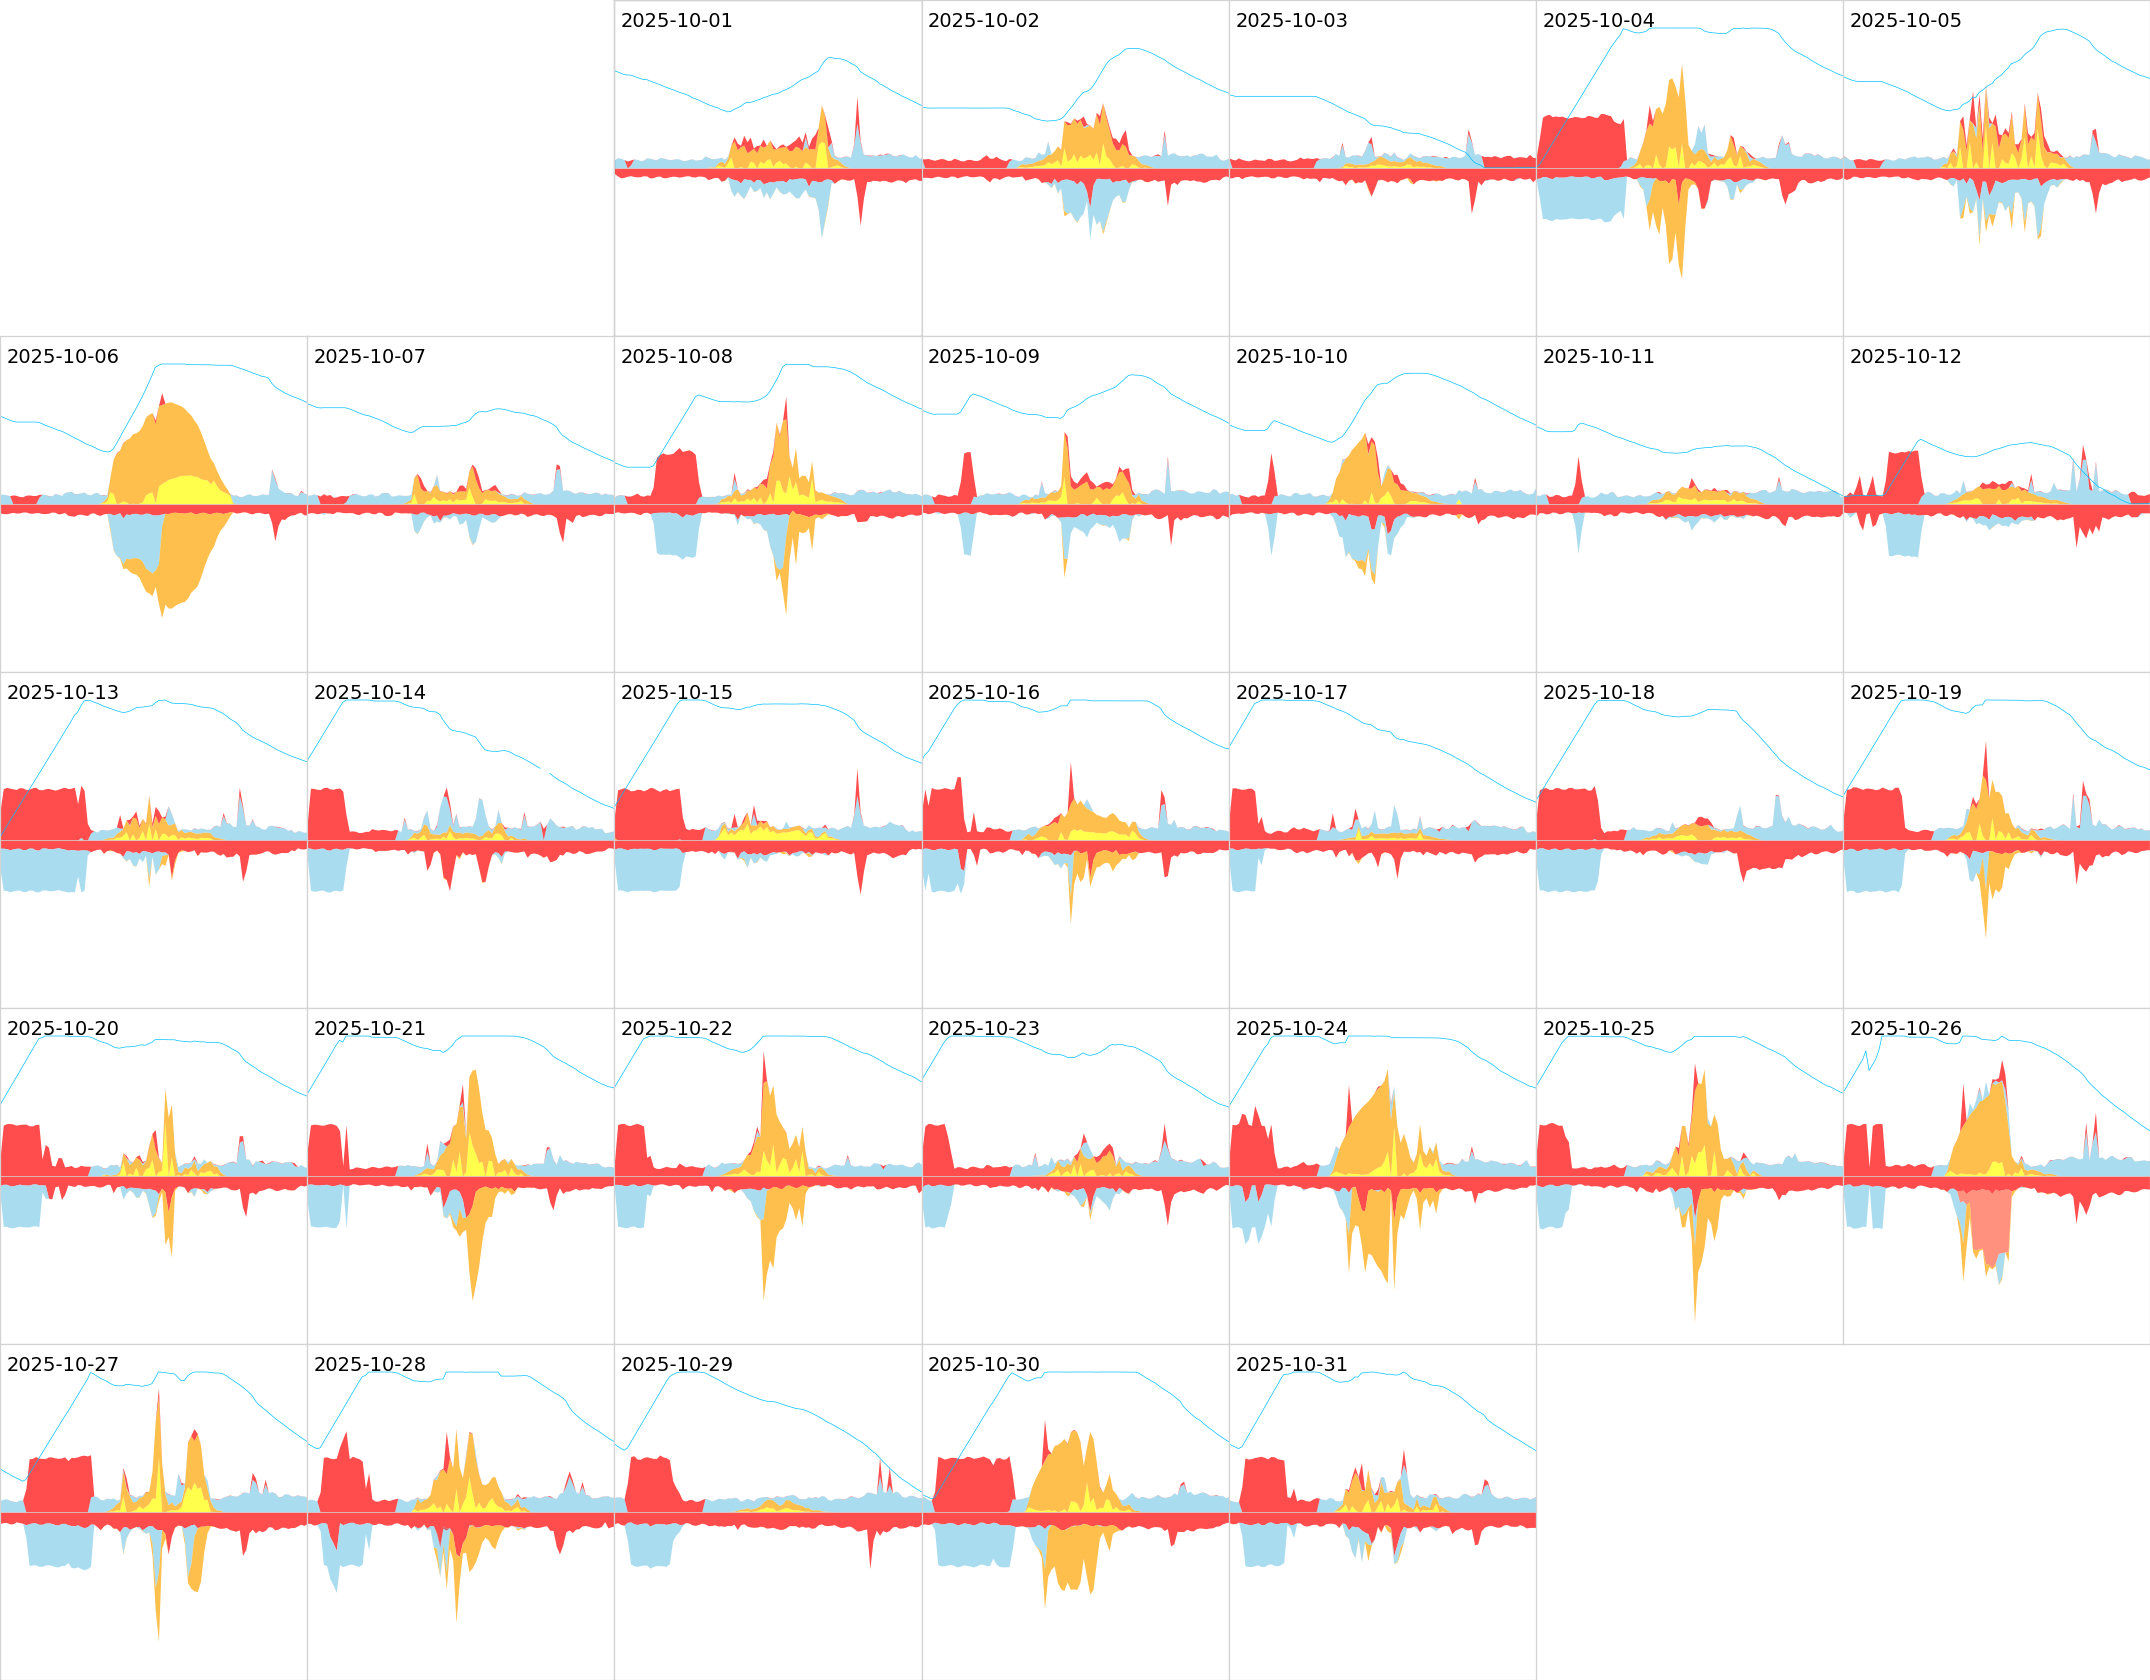
On 14 August the battery stopped discharging around midnight (when there might have been a power cut). We tried resetting the system, but it has not effect. It was remotely rebooted around noon, but only the house started working. We discovered that a fuse had tripped in the garage; when that was reset, all started working again.

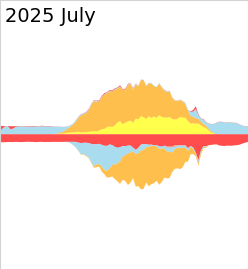
On 18 July we had a very short power cut in the morning, at which point the battery stopped charging. It started discharging normally in the evening. On 28 July the power was off for about half an hour in the morning, as the PV engineers added two new magic boxes to the system to cure the problems with the battery not coming on during power cuts.
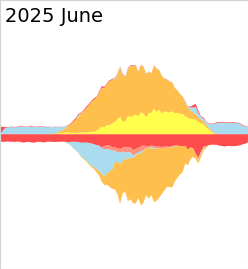
On 4 June, in the late evening, the reported battery level was very erratic; the battery eventually stopped discharging, or recharging, at all on 5 June. Then at about 11pm on the 5th, it started working normally again. On 12 June, we had a ~30min power cut at about 5am, but the battery did not come on as backup as it should; the reported battery level was then very erratic for the rest of the day. On 15 June we had a very short power cut around 10:30 am, at which point the battery stopped charging. It started discharging normally in the evening. On 18 June the power was off for about half an hour in the morning, as the PV engineers attempted to diagnose the problems with the battery. On 30 June, the pump on our rainwater recycling tank failed "on" in the evening (it didn’t auto-stop because there was a leak in the pipe), hence high usage, not spotted until the evening of 2 July.
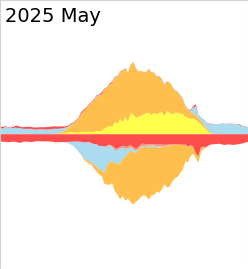
On 26 May the battery started charging around sunrise as expected. But it stopped charging ~8am, despite copious PV production. We switched the charging mode from "green" to "manual" at 9:40am; the battery immediately started charging. We've left it on manual since, which means we use the battery more overnight during the "cheap" rate tariff.
The battery charging wobblies seem to have gone away, but on the 5th and the 27th the system did not report the charge on the battery, and so the (blue) charge line is missing. However, the solid blue areas shows that the battery was being charged/discharged appropriately.
There were some wobblies with the battery charging. On the 9th, it stopped discharging at midnight, and didn't charge during the day; the garage PV also stopped generating. (Additionally, the import and export data are missing from the logs, hence the weird graph for that day.) On the 28th, it never started discharging once the PV generation dropped, and stayed at 100% until the 31st, when it started working again; again the garage PV also stopped generating. We have been told this was due to a “software problem”. The software has been upgraded, so the problem should not reappear. We shall see.
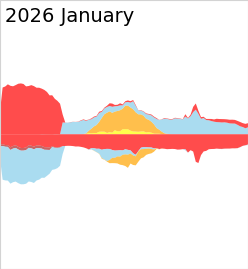
There is some mains usage data missing on the night of 10 Jan, which is why it looks strangely bumpy.

Overnight has seen a lot of battery charging, plus one car charge on 21 Dec. On 3 Dec and 4 Dec thean upgrade to the system was installed that allows us to keep using the battery/PV if there is a power cut. Not coincidentally, from 4 Dec midday to 7 Dec evening the domestic use (red area below the axis) was not being recorded, and has been set arbitrarily to 1kW. Also not coincidentally, from 4 Dec midday, the generation from garage PV (yellow area above the axis) has not been recorded, and is omitted (at this time of year it is very small anyway); we are hoping to get this issue fixed in the new year. On 23 Dec, the automatic charge scheduler didn't charge the battery overnight; since then we have been using a manually determined charge schedule.