Acute Physical Health Shocks and Mental Health Care
Wei Song
Supervisors: Panos Kasteridis, Rowena Jacobs
Health Econometrics and Data Group
2nd October, 2024

[1.0] Background and motivation
-
Physical and mental health are closely related with biological and behavioural pathways.
30% of people with LTCs have mental health problems;
46% of people with mental health problems have LTCs.
(Naylor et al., 2012) - More research focuses on how mental health impacts physical health. Reciprocal pathways and endogeneity bring about challenges in modelling impact.
[1.1] Acute phyiscal health shock
- Acute myocardio infarction, cerebral infarction, and new diagnosis of cancer
- Unanticipated timing helps with the endogeneity problem
- The experience of an acute physical health shock are shown to negatively impact risk for depression and general anxiety disorder.
- Would acute physical health shock impact mental health service utilisation? If so, would it be increased or decreased?
[1.2] Research question
- How does the experience of acute physical health shocks impact the utilisation of specialised mental health care?
- ... for individuals who are existing specialised mental health care users
- How to capture acute physical health shock?
- How to deal with different timing for treatment and outcome measures?
- Would variations in shock intensity complicate measurement, as individuals are displaced due to hospitalisation for shock related physical care?
Possible challenges
[2.0] Data and methods
- Hospital Episode Statistics (HES): Admitted Patient Care (APC)
- Mental Health Services Data Set (MHSDS)
- Population: users of specialised mental health care in 2017/18
- Treatment: first experience of heart attack, shock, or first diagnosis of cancer
- Outcome: days spent in mental health care
[2.1] Mental health care pathways in England
- Primary care: GP referrals, IAPT (talking therapies)
- Community care
- Hospital care at NHS Mental Health Trust (secondary and tertiary)
- Specialist mental health care delivered at physical health setting (integrated care)
[2.2] Data and methods (cont.)
[2.3] Data and methods (cont.)
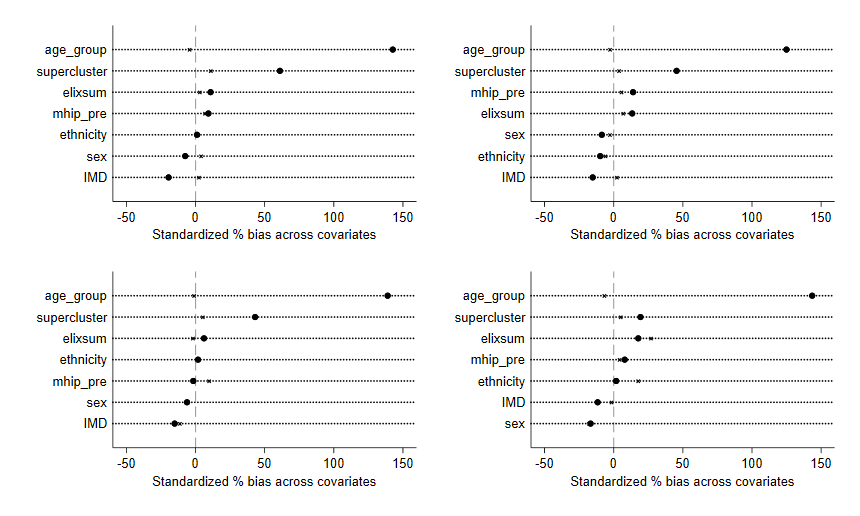
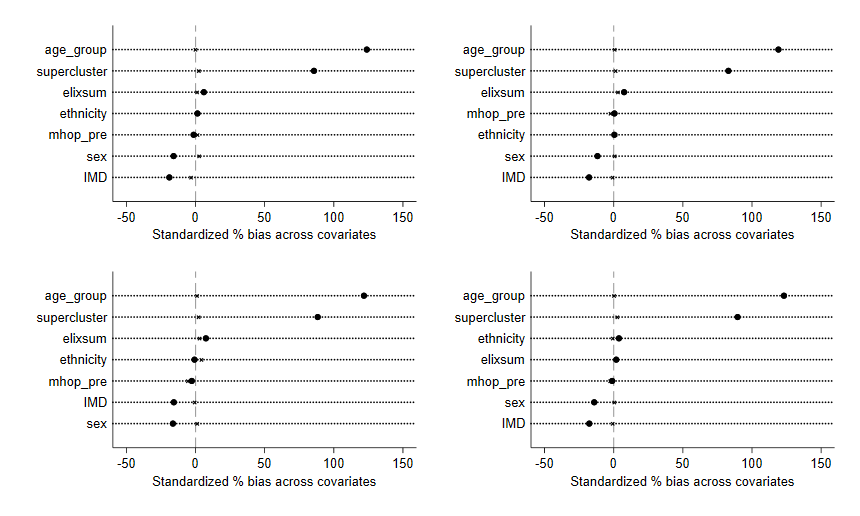
Propensity score matching
Sex Age group Mental health cluster Ethnicity IMD quartile Elixhauser comorbidity index Pre-treatment utilisation of mental health care
[3.0] Econometric setup
\( y_{it} = \alpha_0 + \alpha X_i + \beta d_i + \gamma \lambda + \color{orange}{\delta d_i \lambda} \) + \( u_{it} \)
[3.1] Multi-timepoint design

Each \( \lambda \) represents a three-month period
[3.2] Stacked DiD

\( y_{it} = \alpha_0 + \alpha X_i + \beta d_i + \sum\limits_{t=2}^{T} \gamma_t \lambda_t + \sum\limits_{t=T_s}^{T} \delta_t(d_i \lambda_t) + u_{it} \)
[3.3] Treatment intensity
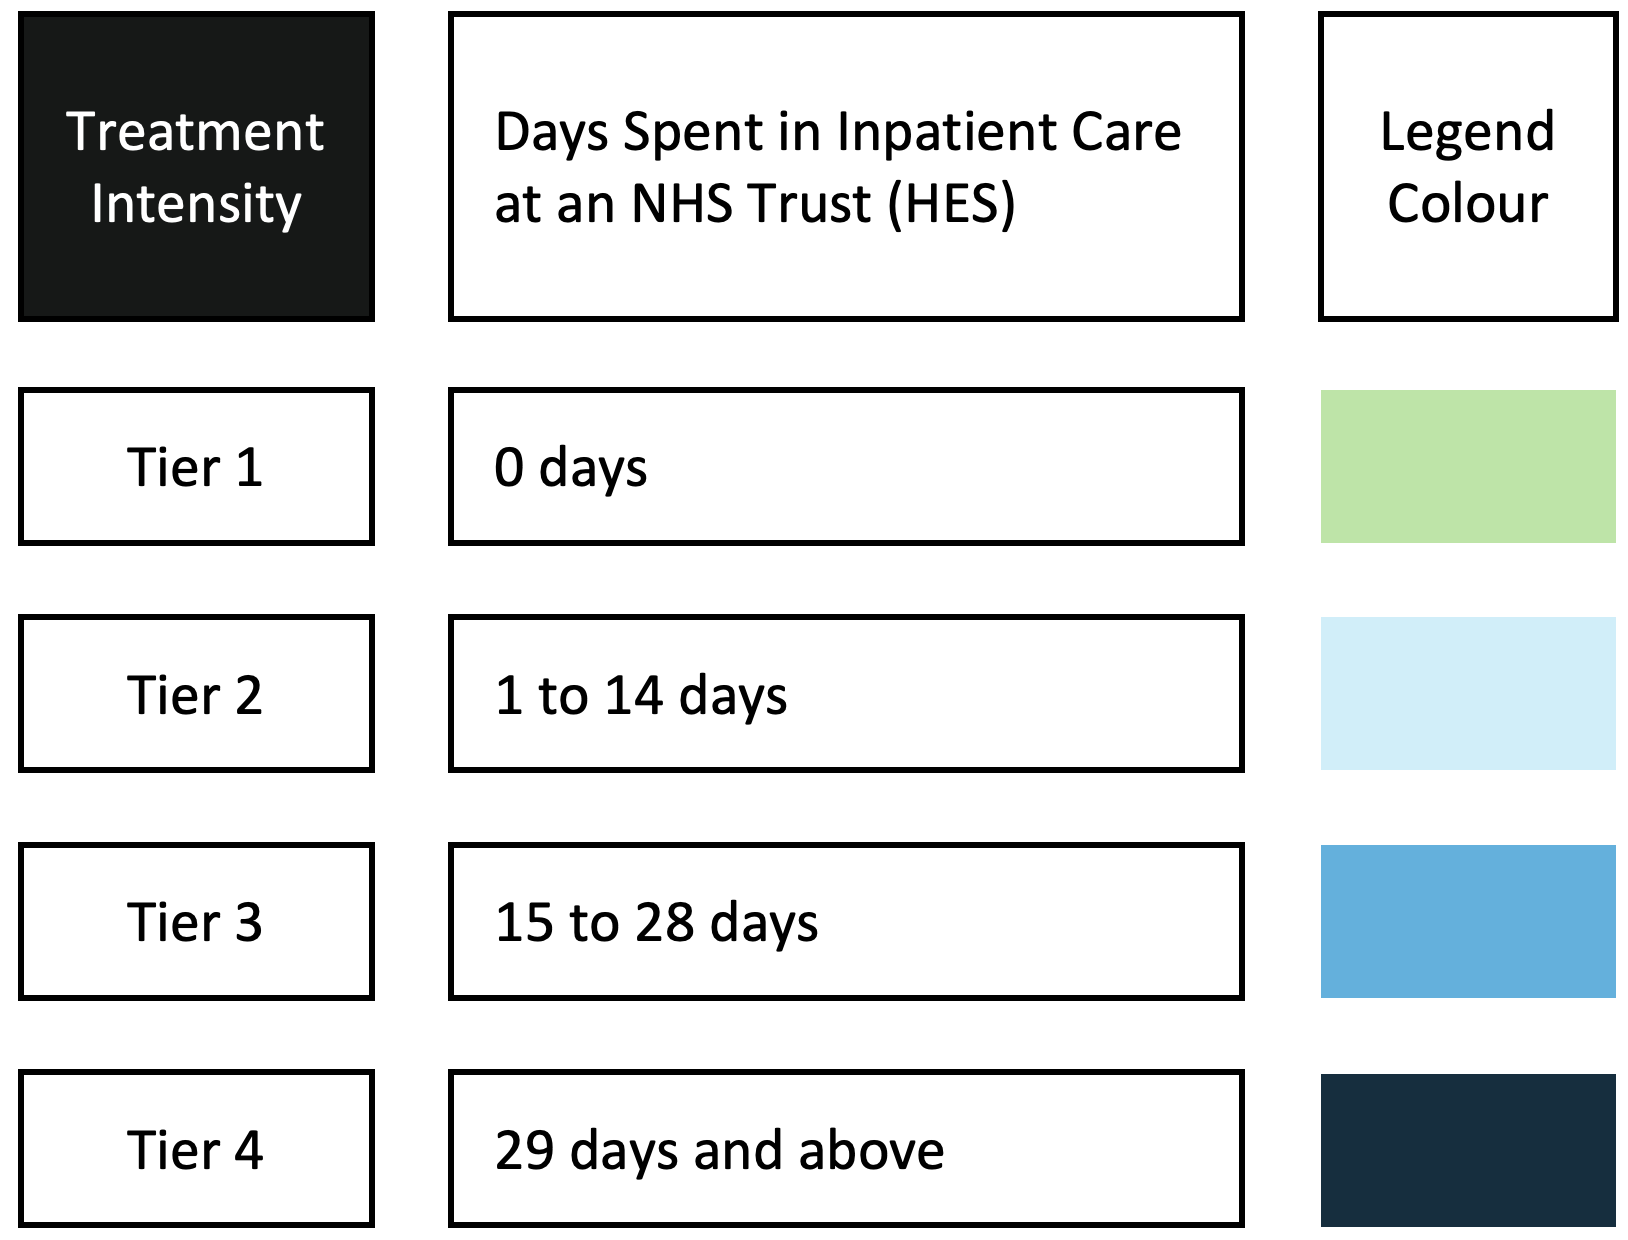
\( \small y_{it} = \alpha_0 + \alpha X_i + \sum\limits_{k=1}^{K} \beta_k d_{ik} + \sum\limits_{t=2}^{T} \gamma_t \lambda_t + \sum\limits_{k=1}^{K} \sum\limits_{t=T_s}^{T} \delta_{tk}(d_{ik} \lambda_t) + u_{it} \)
[4.0] Results for inpatient: covariate balance
[4.1] Inpatient (cont.)
- Total number of inpatient bed-days: 7.4m for 2016/17, 7.5m for 2019/20
- Average number of inpatient bed-days: 7 to 8 days per quarter
- Higher utilisation in July to December time
[4.2] Inpatient (cont.)
[4.3] Inpatient (cont.)
[4.4] Inpatient (cont.)
[4.5] Inpatient (cont.)
Men
Women
[5.0] Results for outpatient: covariate balance
[5.1] Outpatient (cont.)
- Total number of days spent in community care: 151m 2016/17, 135m 2019/20
- Average number of days range from 20 to 25 days per quarter
[5.2] Outpatient (cont.)
[5.3] Outpatient (cont.)
[5.4] Outpatient (cont.)
[5.5] Outpatient (cont.)
Men
Women
[6.0] Results, mental health care in physical setting (HES IP)
[6.1] HES IP
Men
Women
[6.2] HES OP
Men
Women
[7.0] Modelling incremental cost
- Chapter 1, survey data that links experience of PHS to increased risk for depression
- Chapter 2, admin data that links experience of PHS to altered utilisation in community and inpatient mental health care
- Chapter 3, a model that facilitates interpolation of cost difference
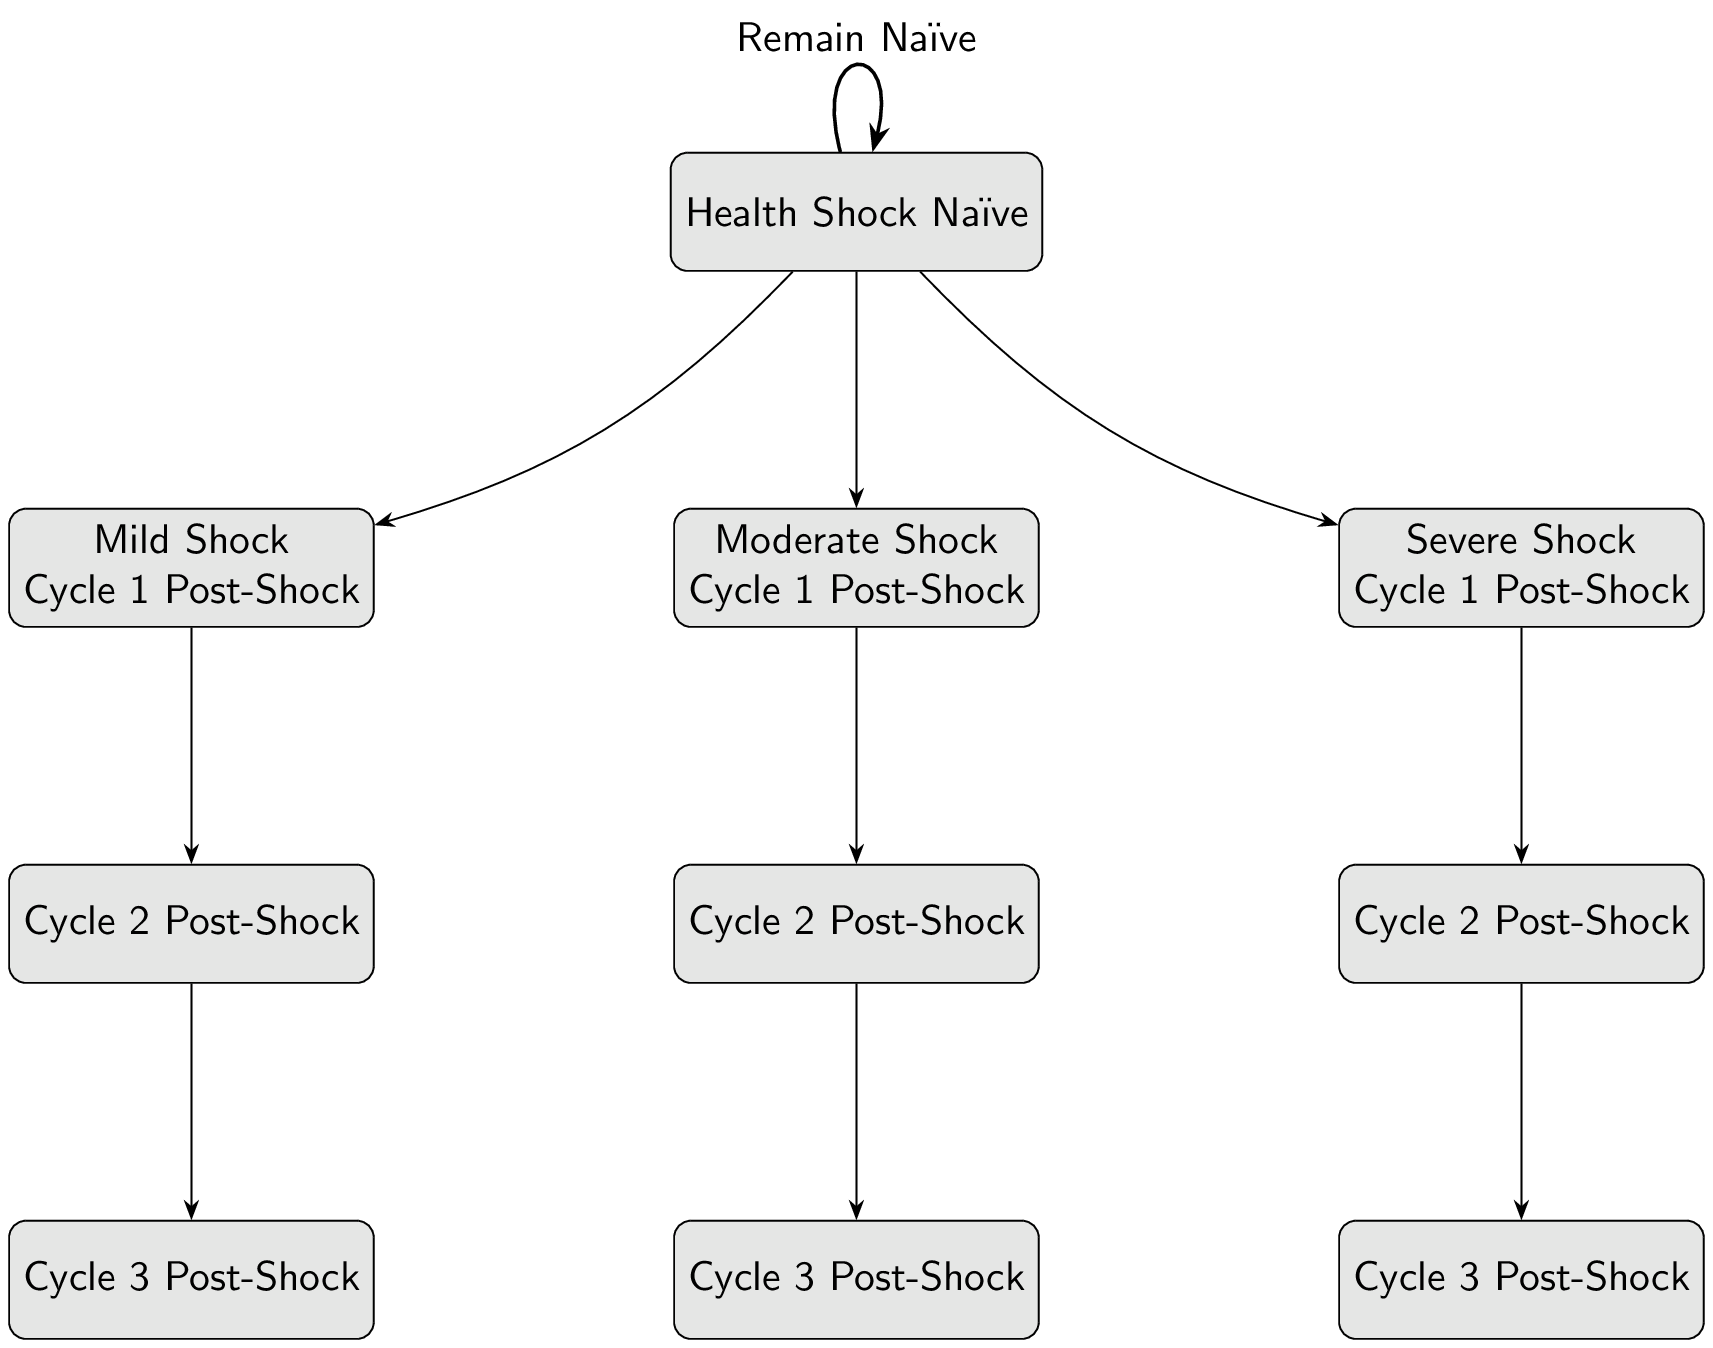
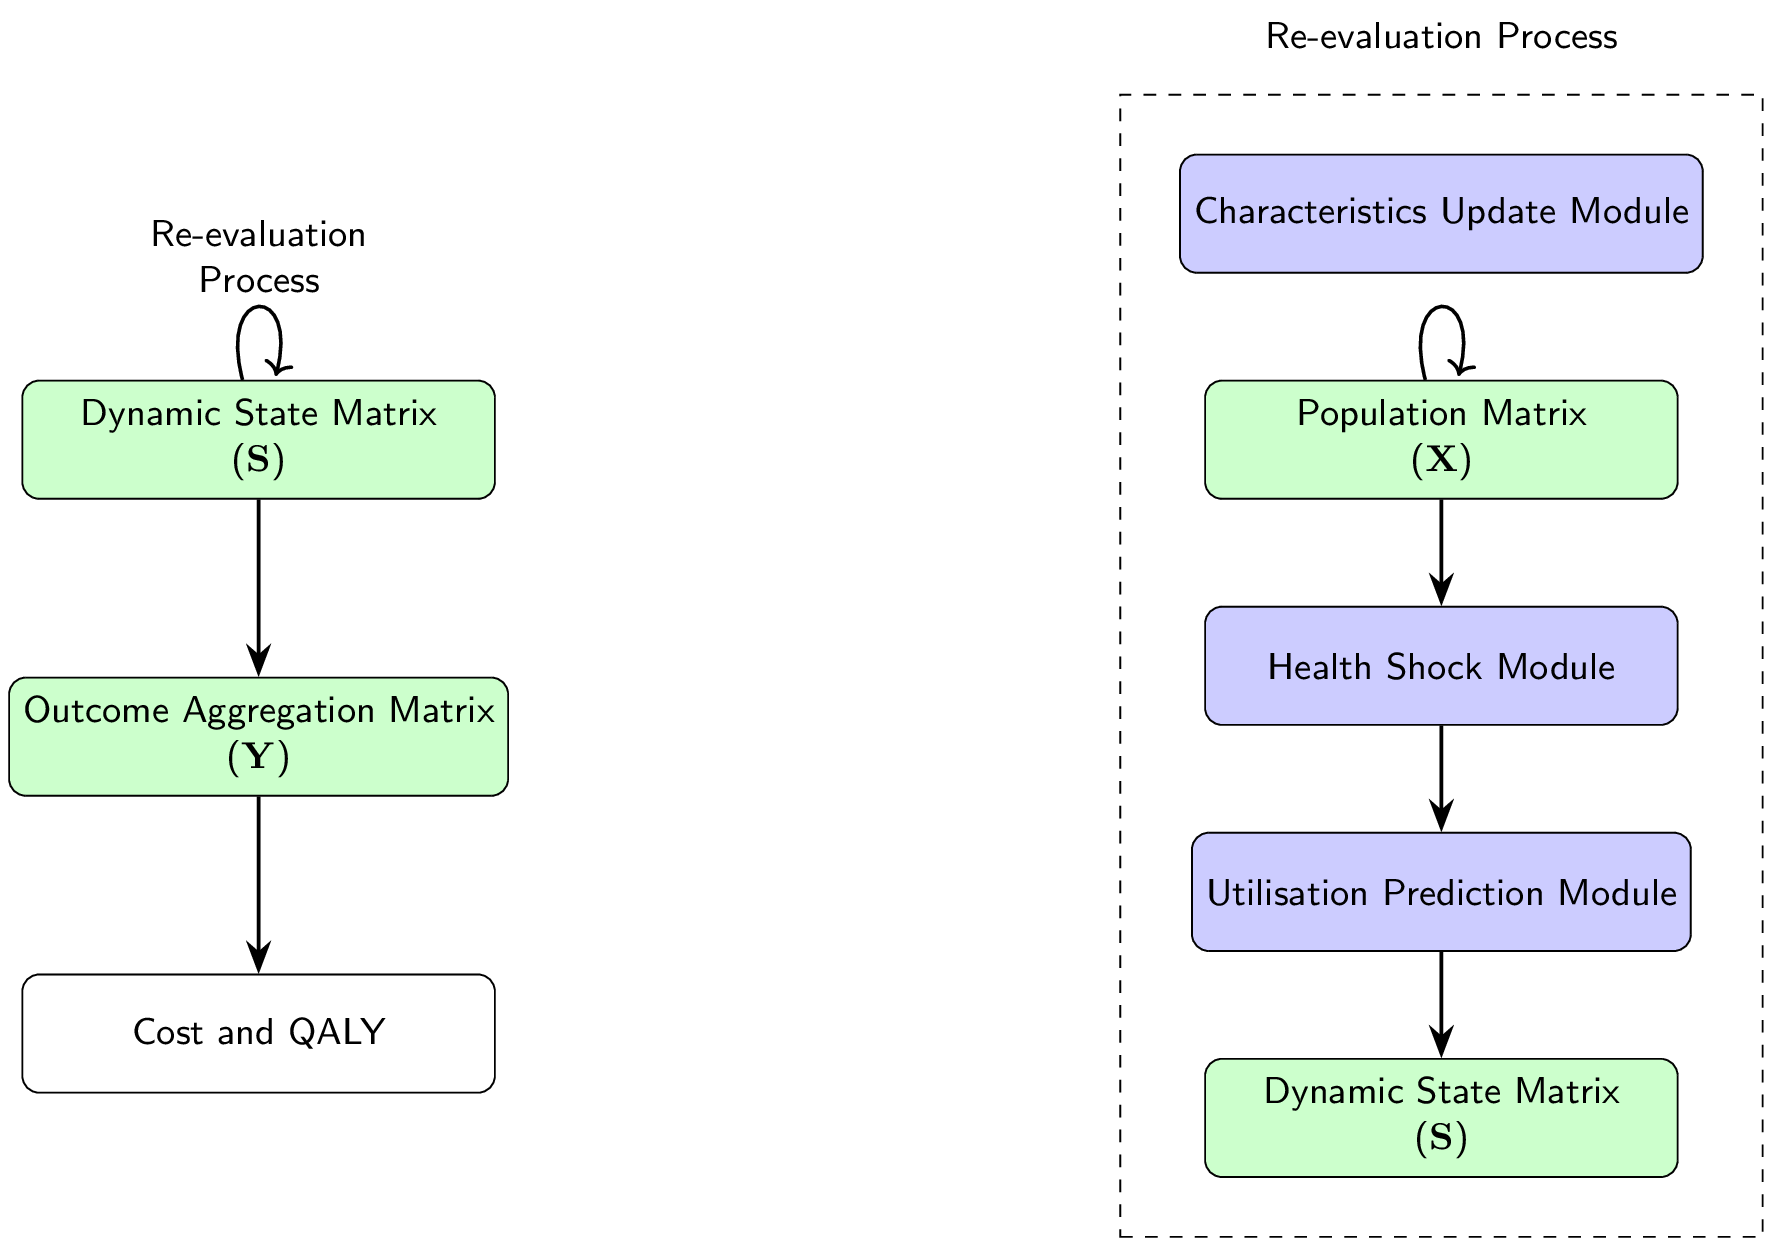
[7.1] State transition
[7.2] Data structure
Population
- Age
- Gender
- Socioeconomic Status
- Comorbidity
- Care Cluster
Dynamic
State
\[
\begin{aligned}
\mathbf{S} = \{ s_{i,t}^{(l)} \mid &i = 1,\dots,N; \\
&t = 1,\dots,T; \\
&l = 1,\dots,L \}
\end{aligned}
\]
- Health shock status
- Utilisation
- QALY
Outcome
Aggregation
\[
%\mathbf{Y} =
\begin{bmatrix}
y_{1,1} & y_{1,2} & y_{1,3} \\
y_{2,1} & y_{2,2} & y_{2,3} \\
\vdots & \vdots & \vdots\\
y_{N,1} & y_{N,2} & y_{N,3}
\end{bmatrix}
\]
- Total utilisation days
- Total QALY
- Care Cluster
- Currencies: HRG & Cluster
[8.3] Model workflow
[8.0] Discussion
Displacement
Removal of utilisation during quarter of shock If present, could be picked up by TE heterogeneity of shock intensity