Physical Health Shock and Mental Health
Wei Song
Supervisors: Panos Kasteridis, Rowena Jacobs
Thesis Advisory Panel: Rita Santos, Nigel Rice

[1.0] Overview
- Chapter 1, survey data that links experience of PHS to increased risk for depression
- Chapter 2, admin data that links experience of PHS to altered utilisation in community and inpatient mental health care
[1.1] Where we were
- The experience of PHS does not cause secondary mental health care utilisation from otherwise naive population
- Overall effect of PHS seems to reduce care in secondary setting
- Why is PHS protective for mental health? Could displacement be present?
[2.0] Data and methods
- Hospital Episode Statistics (HES): Admitted Patient Care (APC)
- Mental Health Services Data Set (MHSDS)
- Treatment: first experience of heart attack, shock, or first diagnosis of cancer
- Outcome: days spent in mental health care
- Covariates: age group, sex, ethnicity group, IMD, Elixhauser, mental health cluster
[2.1] Data and methods (cont.)
[3.0] Econometric framework
\( y_{it} = \alpha_0 + \alpha X_i + \beta d_i + \gamma \lambda + \color{orange}{\delta d_i \lambda} \) + \( u_{it} \)
[3.1] Multi-timepoint design

Each \( \lambda \) represents a three-month period
[3.2] Stacked DiD

\( y_{it} = \alpha_0 + \alpha X_i + \beta d_i + \sum_{t=2}^{T} \gamma_t \lambda_t + \sum_{t=T_s}^{T} \delta_t(d_i \lambda_t) + u_{it} \)
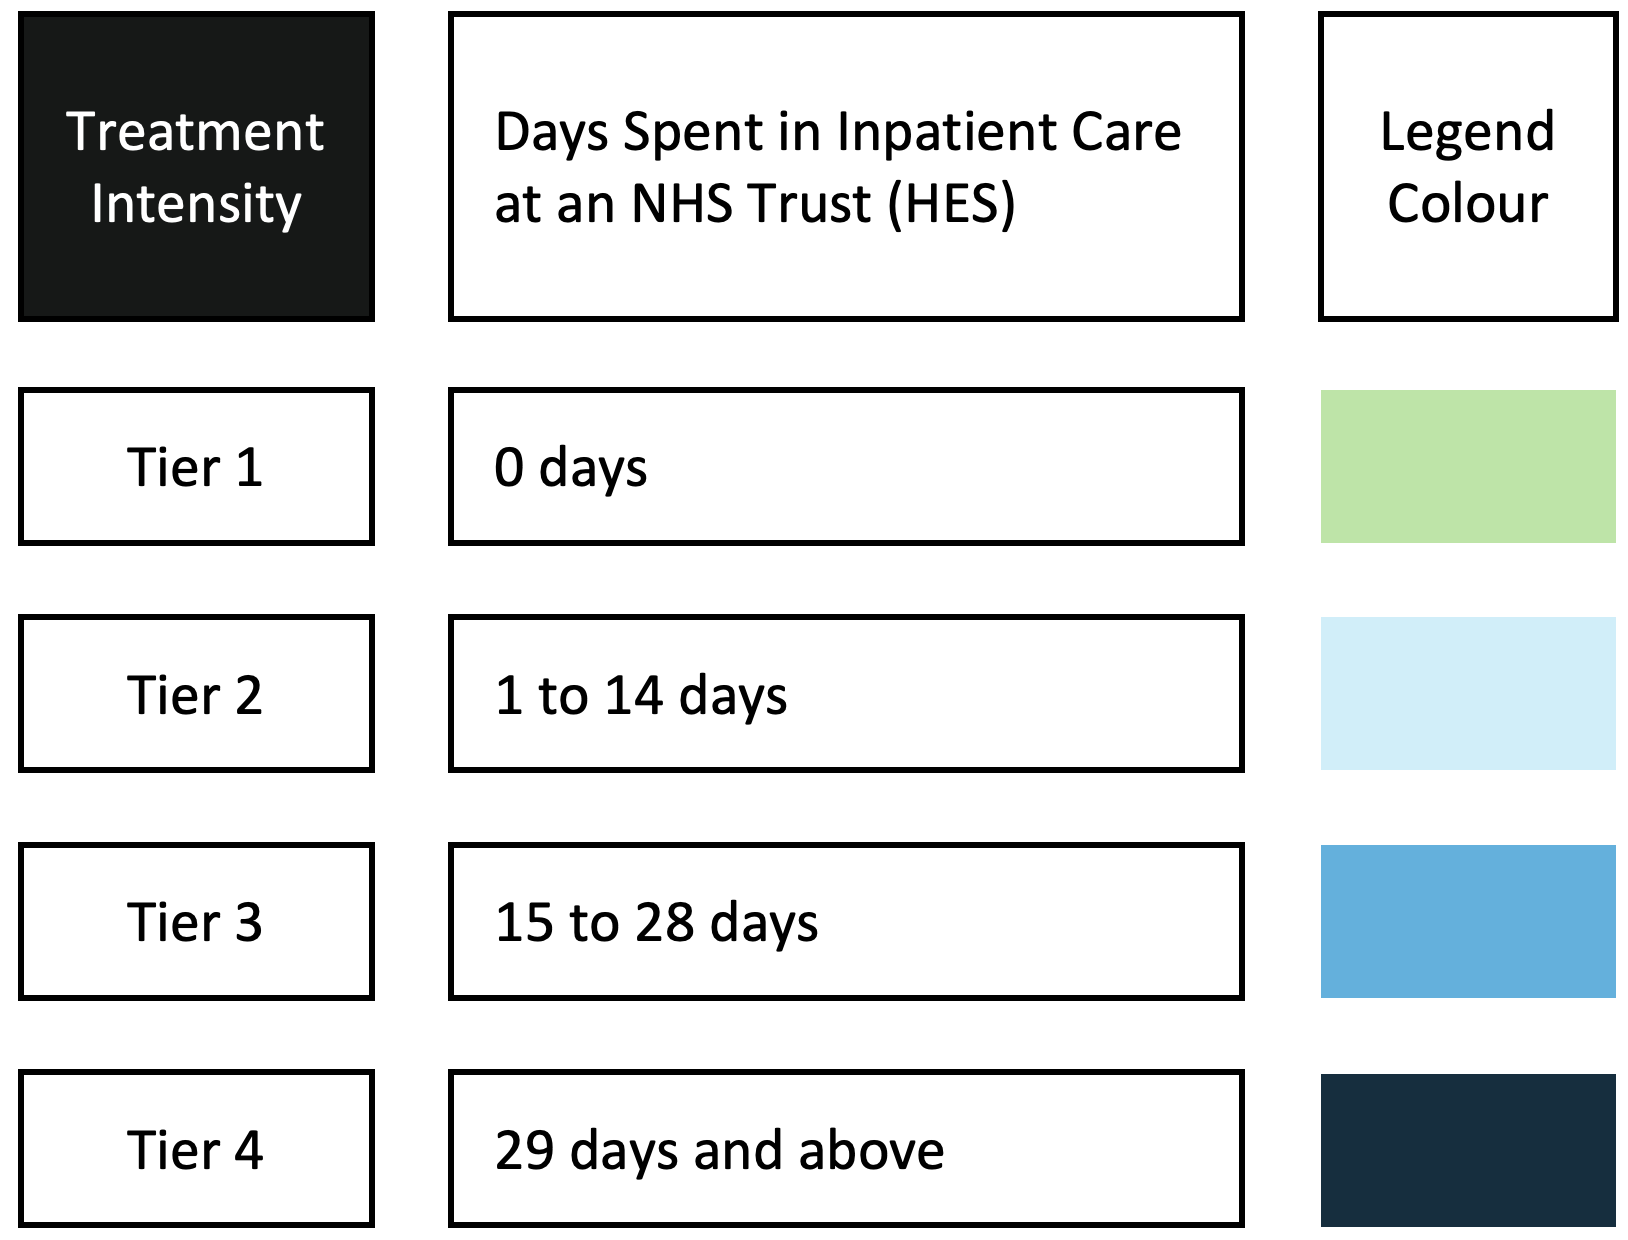
[3.3] Treatment intensity

\( y_{it} = \alpha_0 + \alpha X_i + \sum_{k=1}^{K} \beta_k d_{ik} + \sum_{t=2}^{T} \gamma_t \lambda_t + \sum_{k=1}^{K} \sum_{t=T_s}^{T} \delta_{tk}(d_{ik} \lambda_t) + u_{it} \)
[4.0] Results, inpatient
- Total number of inpatient bed-days: 7.4m for 2016/17, 7.5m for 2019/20
- Average number of inpatient bed-days: 7 to 8 days per quarter
- Higher utilisation in July to December time
[4.1] Inpatient (cont.)
[4.2] Inpatient (cont.)
[4.3] Inpatient (cont.)
[4.4] Inpatient (cont.)
Men
Women
[5.0] Results, outpatient
- Total number of days spent in community care: 151m 2016/17, 135m 2019/20
- Average number of days range from 20 to 25 days per quarter
[5.1] Outpatient (cont.)
[5.2] Outpatient (cont.)
[5.3] Outpatient (cont.)
[5.4] Outpatient (cont.)
Men
Women
[6.0] Results, mental health care in physical setting (HES IP)
[6.1] HES IP
Men
Women
[7.0] Discussion
Concerns from before:
Displacement Overall reduction Window of catchment
Endogeneity
Underestimation of TE: cancer
Staggered design
Heterogeneity of TE
Interaction terms Sub-group analysis
[8.0] Final chapter
- Estimating the Incremental Cost in Primary and Secondary Mental Health Care in NHS England Following the Primary Event of an Acute Physical Health Shock
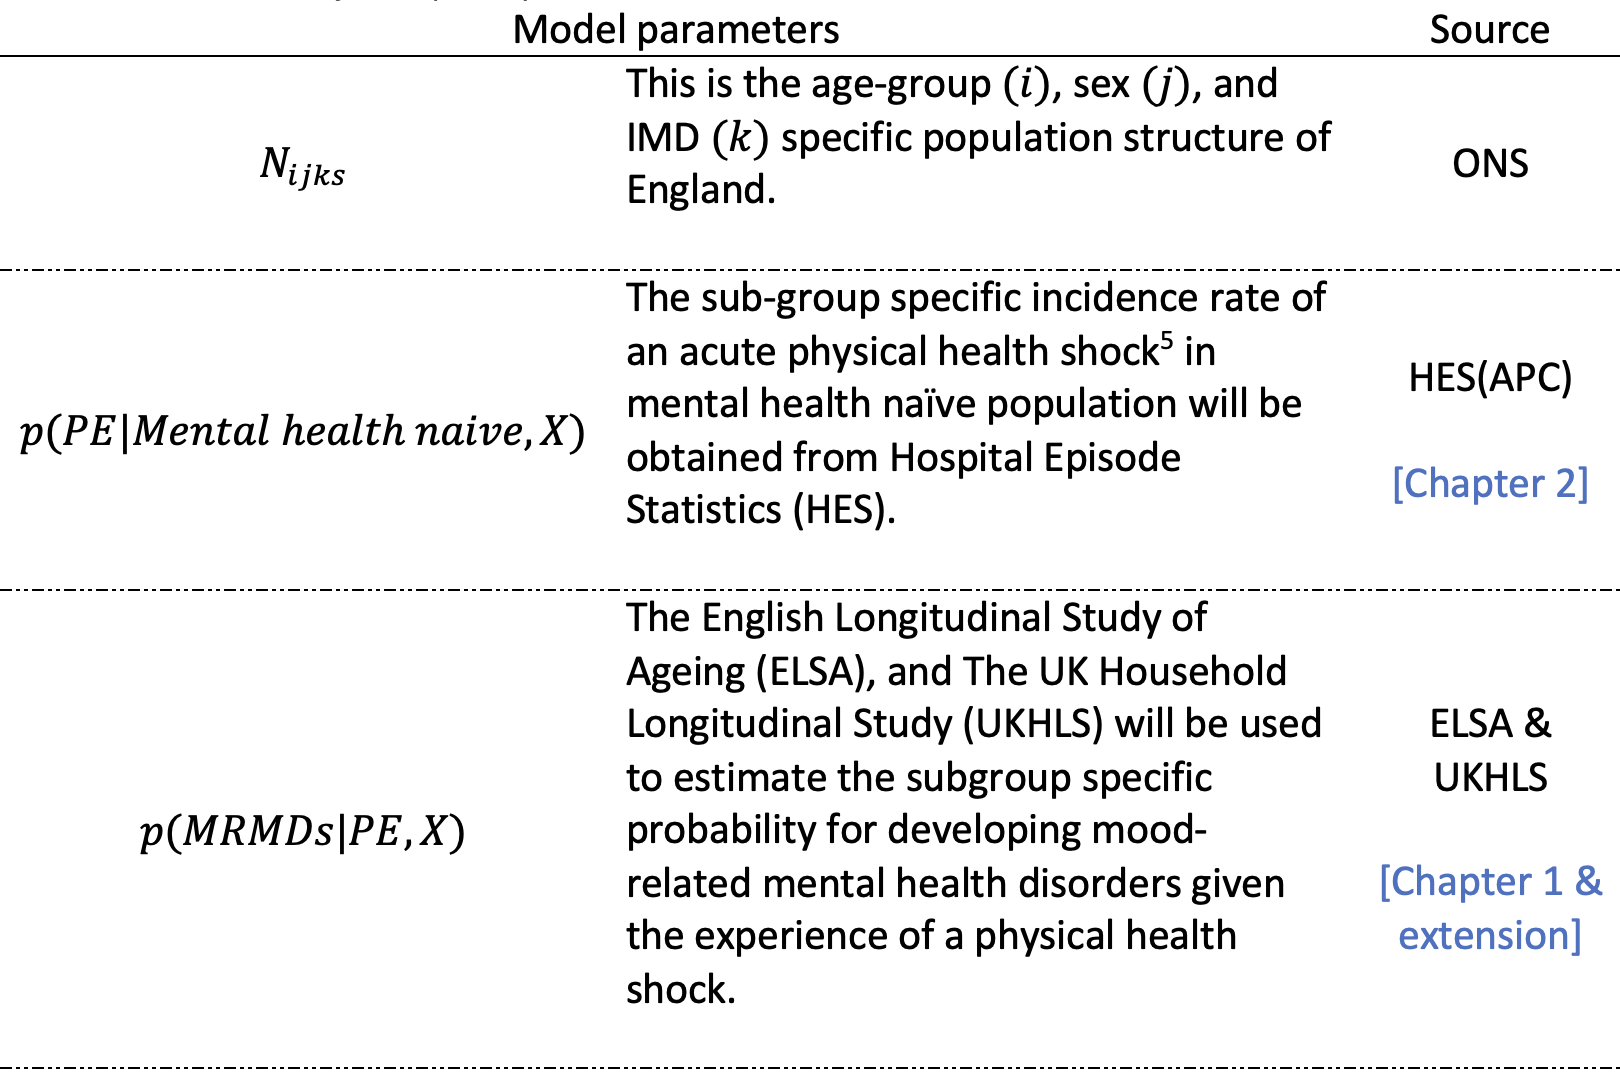
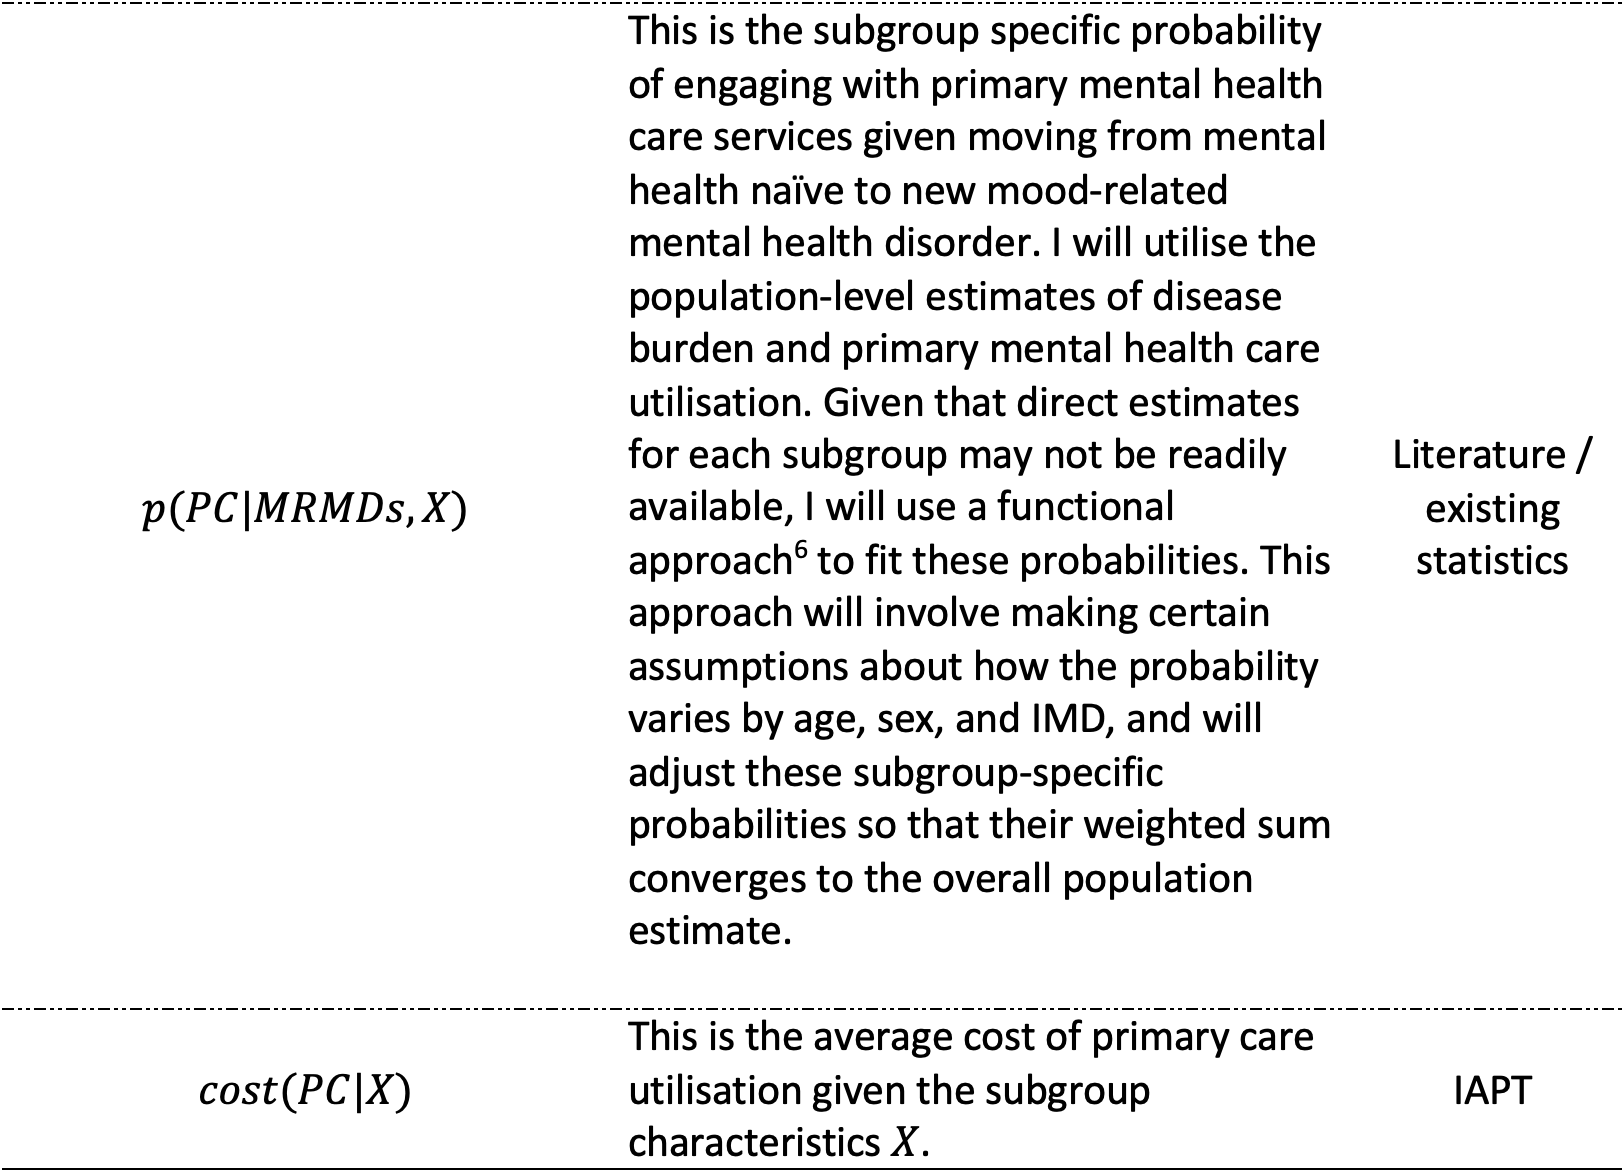
[8.1] Primary care


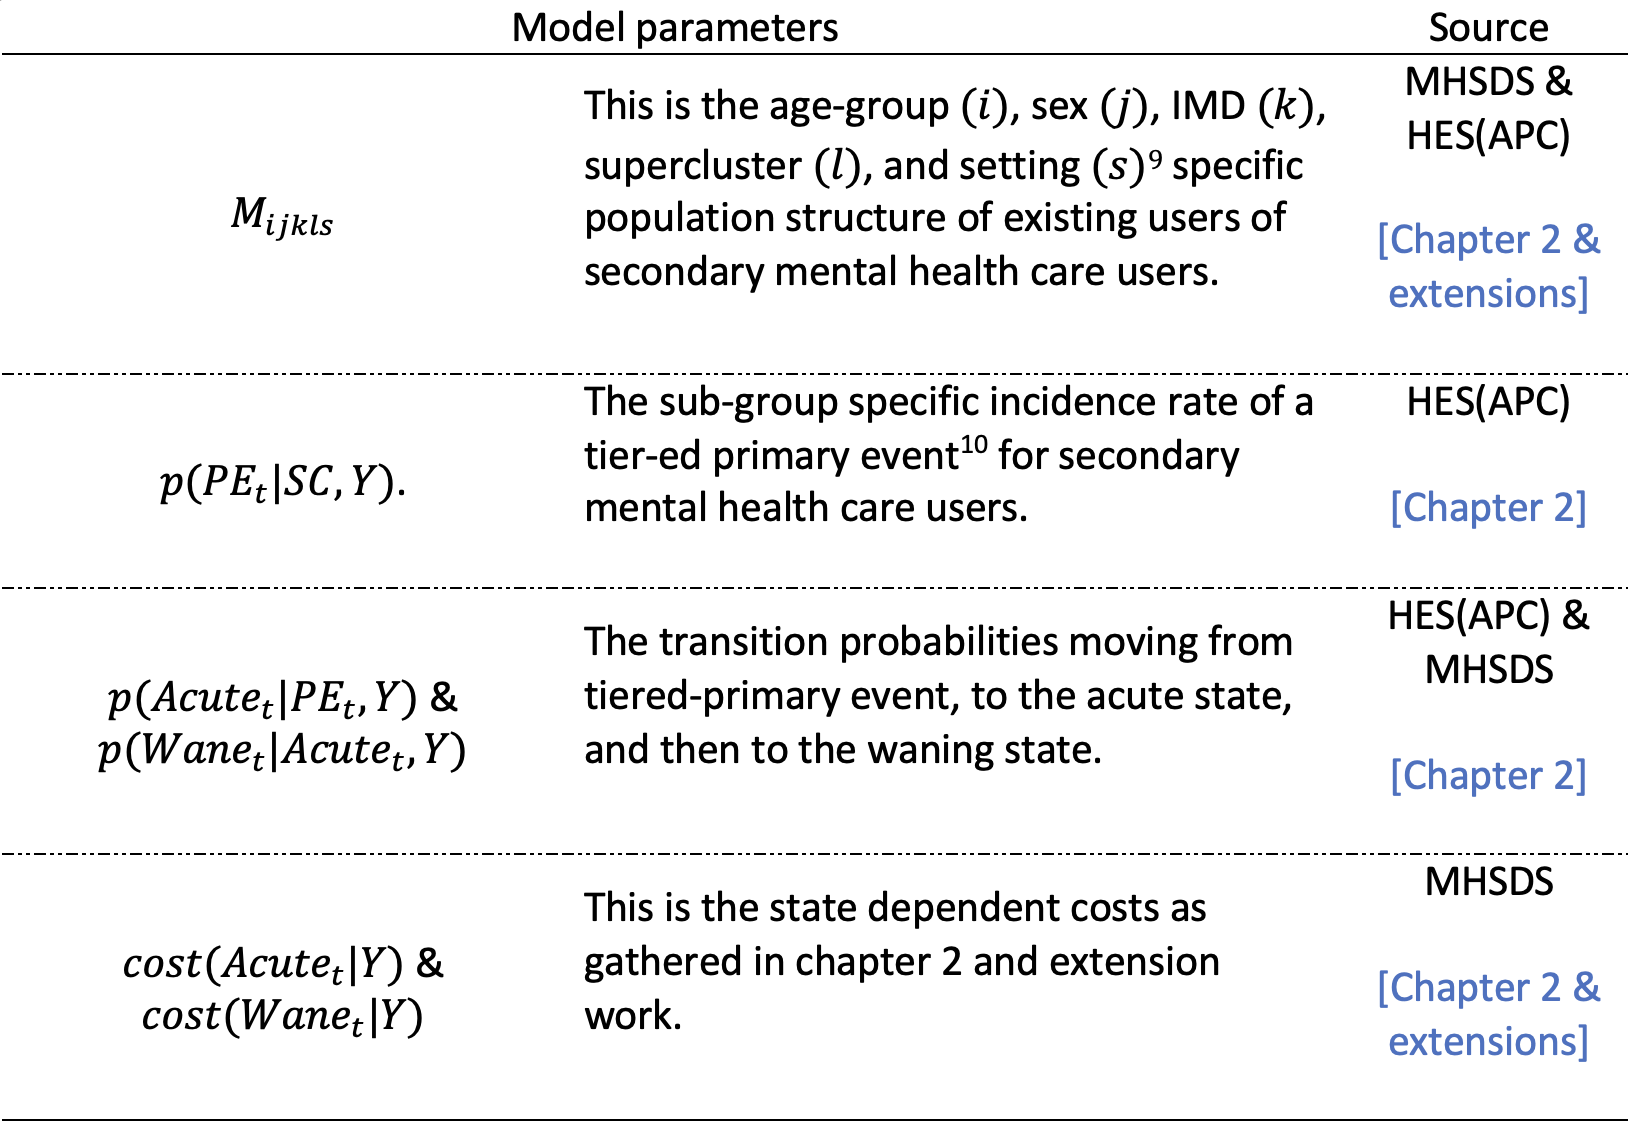
[8.2] Final chapter (cont.)
