Statistical analysis of coverage error in simple global temperature estimators
K. Cowtan, P. Jacobs, P. Thorne, R. Wilkinson
Background
Global mean surface temperature change is a key number which scientists and policy makers use to track the impact of human activity on the climate system. The mathematical definition of the term can be inferred from the name - it is the average of temperature change over the whole surface of the earth. We typically record temperatures on a map divided into a rectangular grid of cells, in which case the global mean can be obtained by averaging the values in the individual cells (taking into account the cell area).
However we do not have observations for the whole of the planet. For recent decades there are near the poles and in parts of Africa with no observations. In the early 20th century and before, the missing regions cover much more of the planet (figure 1).
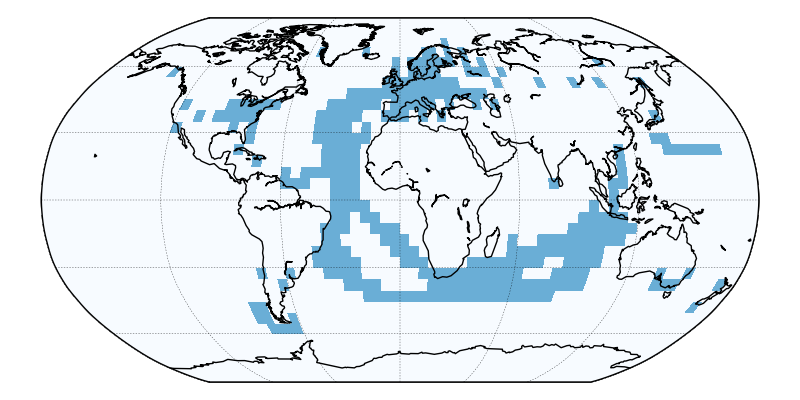
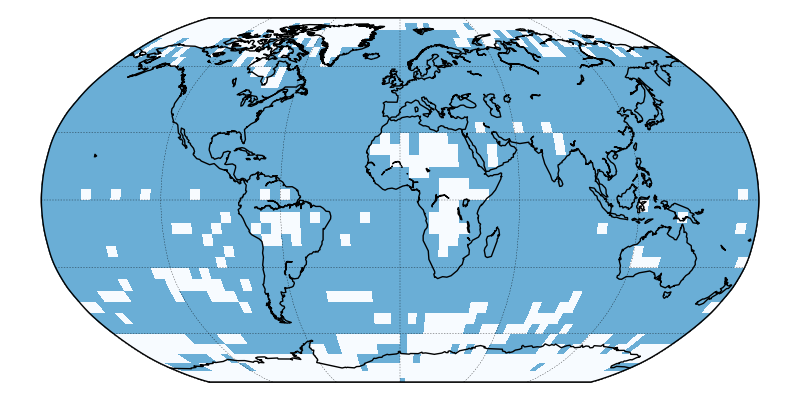
Figure 1: Map of grid cells where observations are available for the HadCRUT4 data set from the UK Meteorological Office, for a month from 1865 and 2015.
The global mean is often calculated by taking the mean of just the grid cells where observations are available. This would be a reasonable approach if places where observations are available were uniformly distributed across the map. However plainly this is not the case, and therefore the simple average gives the wrong answer. As an analogy, if someone were to suggest estimating the average height of adult humans by measuring a group in which 80% of the people were men, most of us would recognize that we would get a misleading result (figure 2).

Figure 2: Estimating how tall an average person is from a sample consisting of mostly men gives a misleading answer.
This problem was solved in a statistically rigorous way by Ruvim Kagan in the 1970's, who introduced a method called 'Optimal Averaging'. However while his work was used both in the UK and the US in the 1990s, many groups have reverted to using simple (area weighted) averages, even when some of the data are missing. In some cases this may be because there are benefits in using simple methods - they are easier to maintain, easier to understand and more transparent to the users. In other cases it may arise because users are not aware of the statistical problems: the concept of an average seems so simple that we may not be aware of the hidden complexities.

Figure 3: Kagan's work was published in 1979 in Russian and in 1997 in English.
The aim of our paper is two-fold:
- We explain the problem of calculating the average of a grid when some cells are missing to a wider audience.
- We introduce a simplification of the optimal averaging method, which while inferior to Kagan's full method, provides most of the same benefits for recent decades.
Some of this may seem abstract and technical. However the choice of statistical methods can have real world impacts. The use of a simple average was one contributory factor (along with changes in the way sea surface temperatures are measured [1][2][3]) to the perception of a 'hiatus' in global warming between 1998 and 2013. When all the known issues with the data are corrected, there is no evidence of a significant change in the rate of warming over this period.
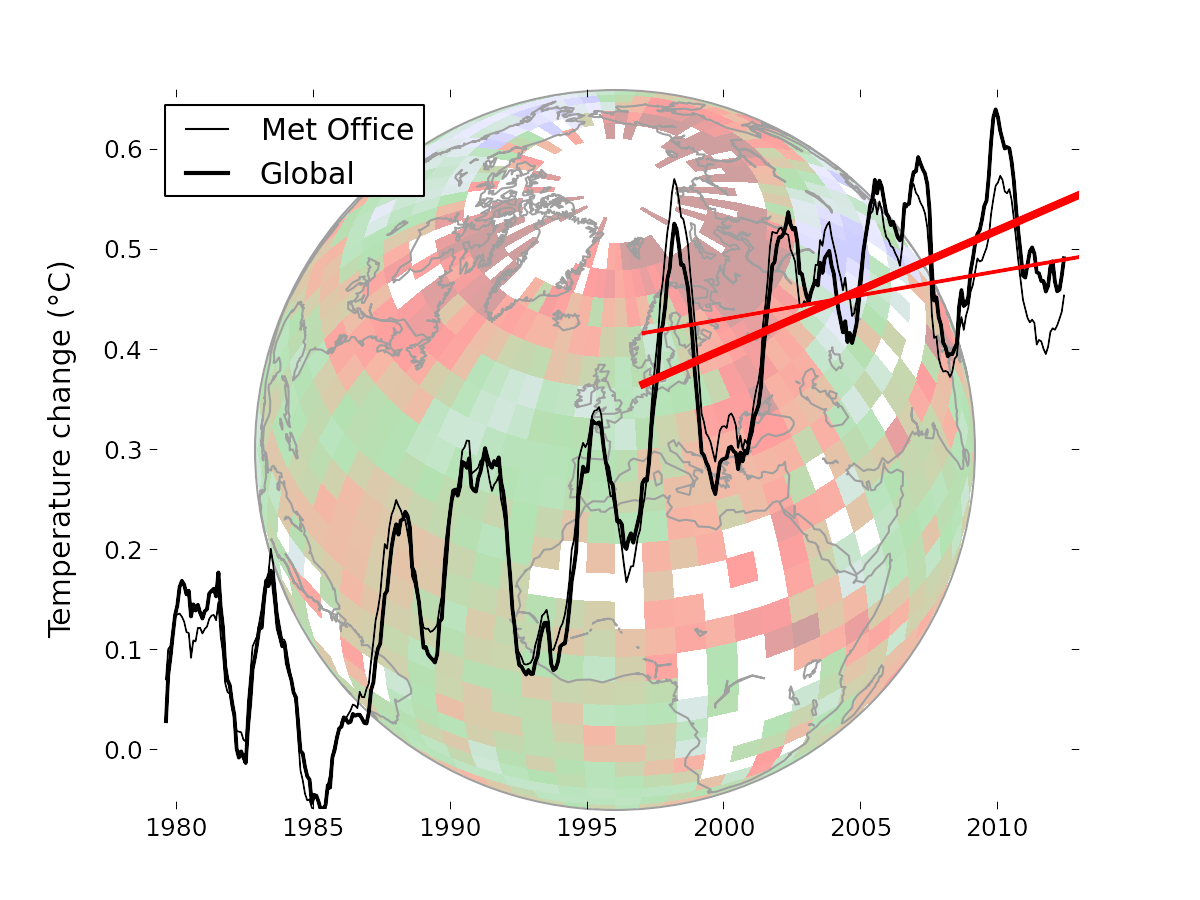
Figure 4: Coverage was a contributory factor to perceptions of a 'hiatus' in warming.