Robust comparison of climate models with observations using blended land air and ocean sea surface temperatures
Kevin Cowtan, Zeke Hausfather, Ed Hawkins, Peter Jacobs, Michael E. Mann, Sonya K. Miller, Byron Steinman, Martin B. Stolpe, Robert G. Way
Background
Climate models are used to estimate the likely range of warming we will see in the future for a given level of fossil fuel emissions. However there are some aspects of the climate system (notably clouds) which are not perfectly understood, and so climate models give us a range of possible outcomes.
We can get an idea of whether the models will predict future climate change from how well they can reproduce the warming which has happened already. This is done by comparing the global mean temperatures from many climate model simulations to the observed temperature record. A typical comparison is shown in the 5th IPCC report (WG1 figure 9.8) - Figure 1.
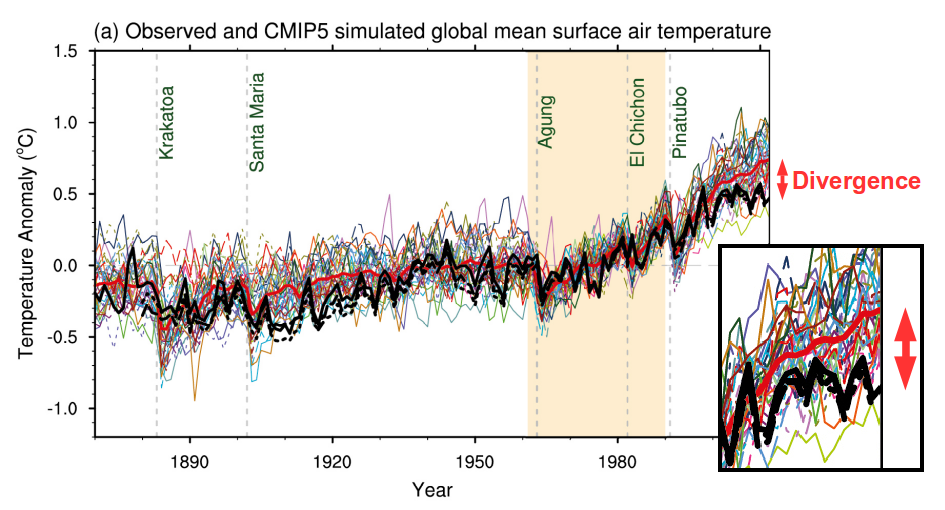
Figure 1: Model-observation comparison from IPCC AR5, modified to highlight the divergence (modified from IPCC AR5 WG1 figure 9.8). The thick red line is the mean of the models. The black lines are the observations.
While the pattern of warming in the 20th century is similar between the models and the observations, over recent decades the models show a little more warming than the observations. We don't expect individual model runs to match one another, because they have different weather. Similarly, the real world has its own weather, so we don't expect it to match the mean of the models. However it is legitimate to ask if the difference between the models and observations can be explained by weather alone.
Part of the explanation lies with recently addressed problems in the observations (Cowtan & Way 2014, Karl et al 2015) and a temporary slowdown in warming associated with changes in ocean circulation and other natural factors (see this lecture and commentary). However we have identified another factor not included in the IPCC graph and similar comparisons: the graph is not comparing the same things. The results from the models use air temperatures over the whole globe, whereas the observations use a mix of air temperature over land and water temperature for the oceans - Figure 2.
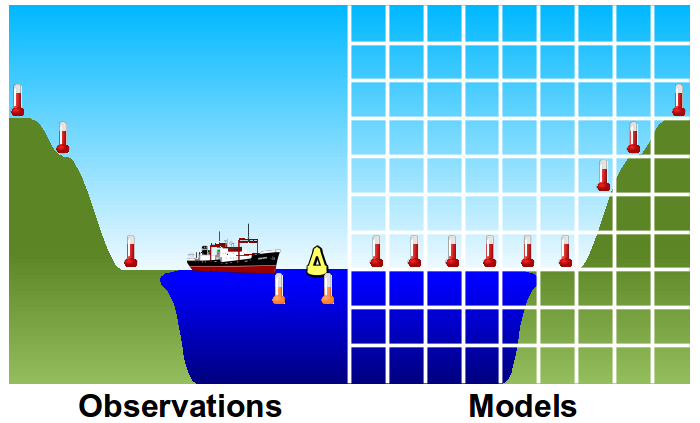
Figure 2: Global temperatures calculated from models use air temperatures above the ocean surface. Observations are based on the water temperature in the top few metres.
In investigating this issue, we also uncovered a second effect which also adds to the model-observation divergence. Global surface temperature records generally incorporate air temperatures over sea ice (since the water under sea ice is insulated from the surface). However with the loss of Arctic sea ice over recent decades, regions of the ocean which were previously given air temperatures switch to sea surface temperatures - Figure 3. This doesn't matter if the two temperatures are measured in the same way. However climate scientists usually work in terms of temperature changes (or anomalies) with respect to some reference period. Air and water temperatures may not be comparable outside of this reference period. In practice air temperatures have warmed faster than sea surface temperatures, and so the loss of sea ice introduces a cool bias in the temperature record at the point when the ice melts.
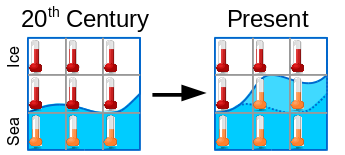
Figure 3: As sea ice retreats, some grid cells change from taking air temperatures to taking water temperatures. If the two are not on the same scale, this introduces a bias.
Climate model results are often compared to the HadCRUT4 data from the UK Met Office. While HadCRUT4 does not extrapolate temperatures over sea ice, it turns out that it is affected by the same bias, due to the progressive appearance of sea surface temperature observations in parts of the ocean which used to be ice-bound.
If we compare different approaches to calculating global mean temperatures from climate models, we see different results - Figure 4.
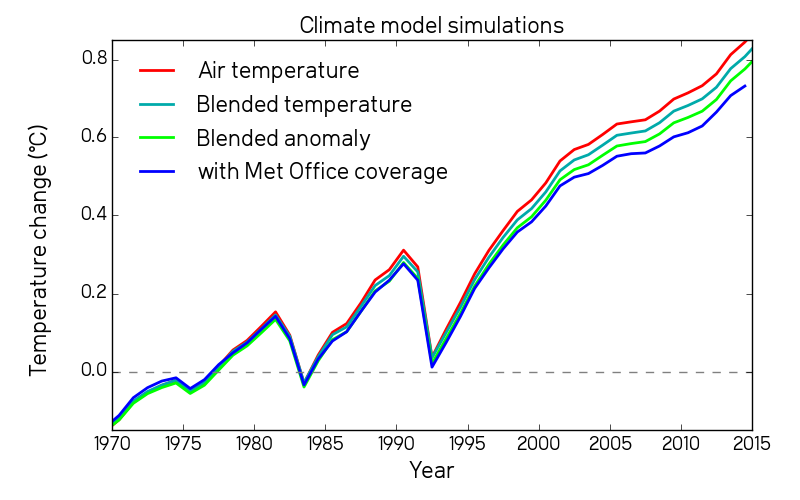
Figure 4: Global mean temperature calculated from an ensemble of climate models using the simplest method (red), or using the same method we use for the observations (blue), and some intermediate methods. (Note that all but the blue line are global coverage.)
The simplest way of calculating global temperature change is to use the simulated air temperature from the models over the whole planet. This method also produces the fastest warming. As we change the calculation method to better reflect how we collect the observations, the amount of warming is reduced. Climate models appear to over-predict warming in part because we are not doing a like-with-like comparison.
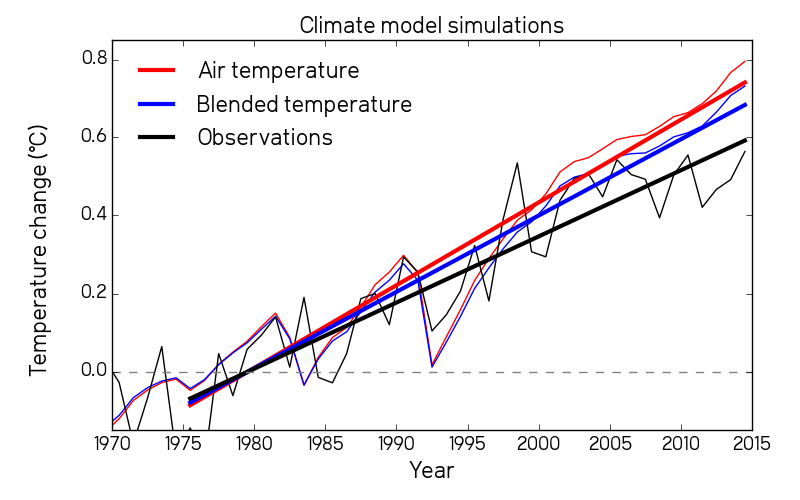
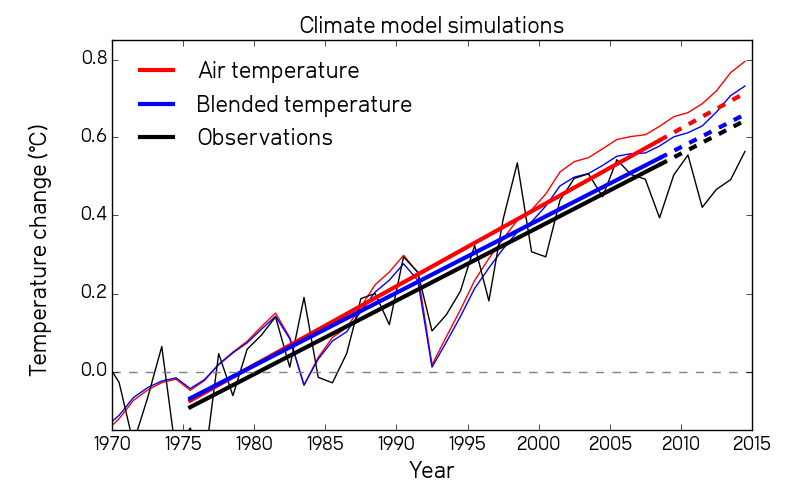
Figure 5: Comparison of models to observations using the IPCC method and the correct method. Thin lines are annual mean temperatures, thick lines are the trends on the period since 1975. (The data in this case are not global, but restricted to where HadCRUT4 has coverage.)
A like-with-like comparison of models to observations reduces the discrepancy in trend since 1975 by at least a third. Furthermore, the discrepancy is very recent in origin: until the middle of the last decade there is no discrepancy in trend between the models and observations. This is consistent with another recent study by Marotzke and Forster.
The discrepancy is also affected by the choice of emission scenario. Our comparisons are based on simulations using the RCP8.5 scenario, which probably overestimates the expected warming over the past decade (see Schmidt et. al.).
"Recent studies suggest that the so-called 'hiatus' in warming is in part due to challenges in assembling the data. I think that the divergence between models and observations may turn out to be equally fragile."
Kevin Cowtan