Bland JM, Altman DG. (1986). Comparing methods of measurement: why plotting difference against standard method is misleading. Lancet, 346, 1085-7.
The text of the paper is reproduced below as it appeared in the Lancet. I have resisted the great temptation to improve it.
The paper is available in HTML format (below) or in an Adobe Acrobat PDF
version. If you do not have Adobe Acrobat, you can download it free from this
link:
![]() Get Adobe Acrobat PDF Reader.
Get Adobe Acrobat PDF Reader.
![]() Download PDF version of "Comparing methods of
measurement: why plotting difference against standard method is misleading".
(Thanks to Alberto Ferreira for spotting some errors in an earlier web version
of this paper, now corrected.)
Download PDF version of "Comparing methods of
measurement: why plotting difference against standard method is misleading".
(Thanks to Alberto Ferreira for spotting some errors in an earlier web version
of this paper, now corrected.)
The HTML version follows.
J Martin Bland, Ph.D.
Department of Public Health Sciences,
St George's Hospital Medical School,
Cranmer Terrace,
London SW17 0RE
Douglas G Altman, B.Sc.
Medical Statistics Laboratory,
Imperial Cancer Research Fund,
London WC2A 3PX
Correspondence to: Dr J M Bland
When comparing a new method of measurement with a standard method, one of the things we want to know is whether the difference between the measurements by the two methods is related to the magnitude of the measurement. A plot of the difference against the standard measurement is sometimes suggested, but this will always appear to show a relationship between difference and magnitude when there is none. A plot of the difference against the average of the standard and new measurements is unlikely to mislead in this way. This is shown theoretically and illustrated by a practical example using measurements of systolic blood pressure.
In earlier papers [1,2] we discussed the analysis of studies of agreement between methods of clinical measurement. We had two issues in mind: to demonstrate that the methods of analysis then in general use were incorrect and misleading, and to recommend a more appropriate method. We saw the aim of such a study as to determine whether two methods agreed sufficiently well for them to be used interchangeably. This led us to suggest that the analysis should be based on the differences between measurements on the same subject by the two methods. The mean difference would be the estimated bias, the systematic difference between methods, and the standard deviation of the differences would measure random fluctuations around this mean. We recommended 95% limits of agreement, mean difference plus or minus 2 standard deviations (or, more precisely, 1.96 standard deviations), which would tell us how far apart measurements by the two methods were likely to be for most individuals.
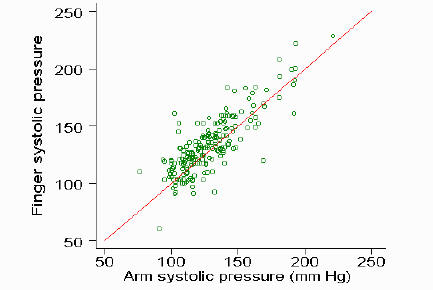
Fig 1. Test and standard measurements, with line of equality
Fig 1 shows a typical data set, the measurement of systolic blood pressure by a test method, the finger pressure, and a standard method, the usual arm blood pressure. This is a random sub-sample of 200 observations from a larger data set discussed elsewhere. [3, 4] The sub-sample was drawn to avoid the graphs appearing cluttered. The mean difference, finger minus arm, is 4.3 and the standard deviation 14.6 mm Hg. Hence the lower 95% limit is 4.3 - 1.96x14.6 = -24 mm Hg and the upper 95% limit is 4.3 + 1.96x14.6 = 33 mm Hg. Thus we estimate that for 95% of subjects the finger measurement will be between 24 mm Hg below the arm measurement and 33 mm Hg above it.
For the mean and standard deviation of the differences to be meaningful estimates we must assume that they are reasonably constant throughout the range of measurement. We suggested checking this assumption graphically. [1, 2] The usual plot, method one versus method two, is inefficient as the points tend to be clustered along the line of equality (fig 1). This is particularly so if the two methods give closely related measurements. We therefore proposed that the difference be plotted against the average of the measurements by the two methods (fig 2).
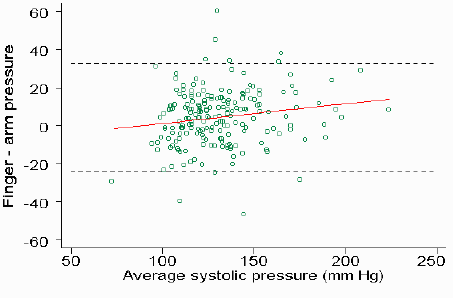
Fig 2. Difference against average of test and standard measurements, with 95% limits of agreement (broken lines) and regression line.
In fig 2 we have also added the 95% limits of agreement and the regression line of difference on average. The main departure from assumptions we were expecting was an increase in variability, shown by an increase in the scatter of the differences, as the magnitude of the measurement increased. There may also be a trend in the bias, a tendency for the mean difference to rise or fall with increasing magnitude. Either of these would show that the methods did not agree equally through the range. In fig 2, for example, there is an increase in bias with magnitude, shown by the positive slope of the regression line. Such deviations from assumptions can often be dealt with by a suitable transformation, usually logarithmic. [2] In particular, this approach will be effective if the differences are proportional to the magnitude of the measurement. The 95% limits of agreement approach has been widely adopted and the Lancet paper [2] widely cited. [5] However, it is sometimes argued that when one method may be regarded as a `gold standard', it is presumably more accurate than the other method and so we should plot the difference against the gold standard. [6,7] We think that this idea is misguided and is likely to lead to misinterpretation. We will show why this is, and that the plot of difference against average is almost always preferable.
We shall denote our standard measurement by S, the new or test
measurement by T, their variances by  and
and
 , and their correlation by
 . If the study
includes a wide range of measurements, and unless the two methods of
measurement have very poor agreement, we expect and
to be similar and
to be fairly
large, at least 0.7. We can examine the possibility of a relationship
appearing in the plot from the expected correlation coefficient between
difference and average, which can be shown to be
. If the study
includes a wide range of measurements, and unless the two methods of
measurement have very poor agreement, we expect and
to be similar and
to be fairly
large, at least 0.7. We can examine the possibility of a relationship
appearing in the plot from the expected correlation coefficient between
difference and average, which can be shown to be
This is zero if the variances are equal, and will be small unless there is a marked difference in the variability between subjects for the two methods.
If there is a genuine trend in the difference with increasing magnitude of the measurement, the variances will be different. For example, if the test measurement tends to be less than the standard for low values of the measurement and greater than the standard for high values, the test measurement will have more very low and more very high values than the standard and so will have a greater variance. Thus there will be a non-zero correlation between difference and average, and the plot of difference against average should show the trend.
The two methods of measurement may also have different variances in the absence of a genuine relationship between difference and magnitude, due to one method having greater measurement error (variation within the subject) than the other. This will only be noticeable if one method has considerably more measurement error than the other, otherwise the effect will be swamped by the variation between subjects in the quantity being measured. We can estimate this measurement error only by making repeated measurements by the same method. In the ideal study, each method would be used at least twice on each subject, in random order, to avoid any time or order effects. [2]
For the blood pressure data, the correlation between difference and average is r=0.17; 95% CI 0.03 to 0.30, P = 0.02), suggesting that there is evidence that the difference increases with the magnitude of the measurement, though the relationship is weak (fig 2). The variances of the two methods differ for the blood pressure data, being 542 for the standard arm measurement and 658 for the test finger measurement (variance ratio test/standard = 1.21, 95% CI 1.03 to 1.42).
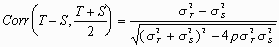
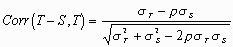
The expected correlation between difference (Test - Standard) and standard is
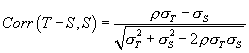
This correlation will usually be negative. In particular, if there is no difference between the variances of the two methods and so no relationship between difference and magnitude, the plot of difference against standard will still show a correlation. In this case, the formula reduces to
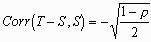
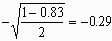
This spurious correlation will be small when the methods being compared are themselves highly correlated, and will increase as the correlation between the two methods themselves falls. For the blood pressure data, the correlation between finger and arm pressures is r = 0.83. The expected correlation between difference and standard in the absence of any genuine relationship between difference and magnitude is therefore
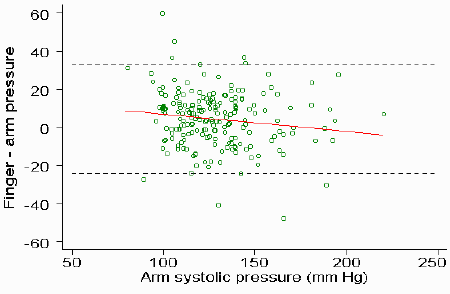
The plot of test minus standard difference against standard shows a downward slope (fig 3).
Fig 3. Difference against standard measurement, with 95% limits of agreement (broken lines) and regression line.
The correlation between difference and standard is r = -0.14; 95% CI -0.28 to 0.00, P = 0.04. Thus we have a negative correlation between difference and standard as predicted, though it is rather smaller than we would have expected. This is because there appears to be a positive correlation between difference and magnitude in this example.
It is worth pointing out that the expected correlation between difference and test measurement is
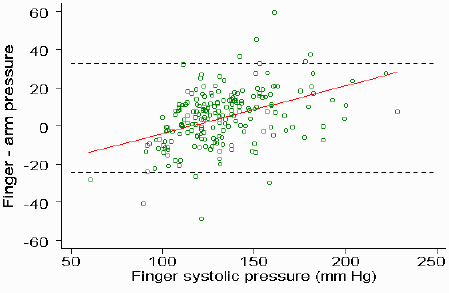
This correlation will usually be positive. Thus in the absence of a genuine relationship between difference and magnitude, the plot of difference against test measurement will suggest a positive relationship, whereas the plot of difference against standard will suggest a negative relationship. This shows that both plots are liable to be very misleading and any relationship found liable to be an artifact of the method of analysis. For the blood pressure data the correlation between difference and the measurement by the test method, finger blood pressure, is r = +0.44; (95% CI 0.32 to 0.54, P < 0.0001) (fig 4). Thus we get significant correlations in different directions!
Fig 4. Difference against test measurement, with 95% limits of agreement (broken lines) and regression line. <3>Conclusions
The plot of difference against standard measurement will show a relationship, whether there is a true relationship between difference and magnitude or not. The plot of difference against the average is more useful in almost all applications to medical measurements.
Altman DG, Bland JM. Measurement in medicine: the analysis of method comparison studies. Statistician 1983; 32: 307-17.
Bland JM, Altman DG. Statistical methods for assessing agreement between two methods of clinical measurement. Lancet 1986; i: 307-10.
Close A, Hamilton G, Muriss S. Finger systolic pressure: its use in screening for hypertension and monitoring. Brit Med J 1986; 293: 775-778.
Altman DG, Royston JP. The hidden effect of time. Stats in Med 1988; 7: 629-637.
Bland JM, Altman DG. This week's citation classic: comparing methods of clinical measurement. Curr Contents 1992; CM20(40): 8.
International Committee for Standardization in Haematology (ISCH). Protocol for evaluation of automated blood cell counters. Clin Lab Haem 1984; 6: 69-84.
Kringle RO. Statistical procedures. in Burtis CA and Ashwood ER, eds. Textbook of Clinical Chemistry, 2nd ed. Philadelphia: W B Saunders, 1994; 384-453.
Back to publications on design and analysis of measurement studies.
Back to frequently asked questions on the design and analysis of measurement studies.
Back to Measurement studies menu.
Back to Martin Bland's home page.
To Douglas Altman's home page.
This page maintained by Martin Bland.
Last updated: 27 July, 2005.