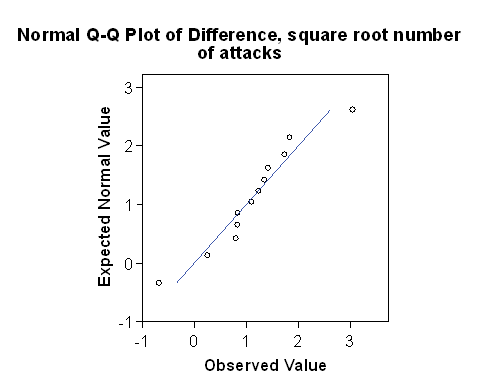
Question 5: If the data do not meet the assumptions of a t test, we may find a mathematical transformation of the data which will do so. We shall try the square root. Compute the difference between the square root of the number of attacks on placebo and the number of attacks on pronethalol and draw a Normal plot.
First we compute the difference. Click Transform, Compute. Type a variable name into the Target Variable box. I used 'differencesr'. We need to get a square root. There is a function for this built into SPSS. Choose the Arithmetic Function Group. Choose Sqrt and use the up arrow to put it into the Numeric Expression box. You should see "SQRT(?)" and I have no idea why it turns into capitals. There is a '?' symbol in the brackets. Replace it by variable 'placebo'. type or click '-', Choose Sqrt and use the up arrow to put it into the Numeric Expression box. Put the variable 'proneth' where the question mark is. You should now have 'SQRT(placebo)-SQRT(proneth)' in the Numeric Expression box. Click OK.
Before drawing the graph, I gave this new variable a label in Variable View. I used 'Difference, square root number of attacks'.
We now draw the Normal or Q-Q plot. Click Analyze, Descriptive Statistics, Q-Q plots. Choose variable 'Difference, square root number of attacks'. Click OK.
I have increased the size of the text on the graph and improved it in various ways:

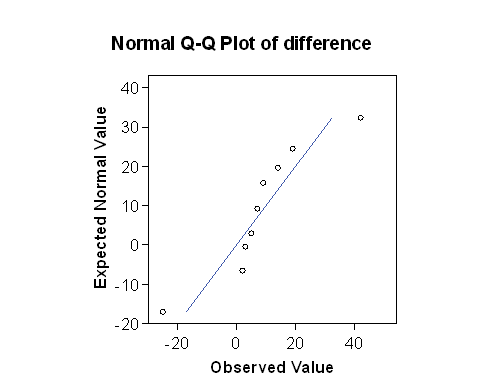
If we put the two Normal plots side by side:


The plot for the square root transformed data looks much closer to the straight line than does the one for the untransformed raw data. The approximation to a Normal distribution looks better for the transformed than for the raw data.
Back to Exercise: Normal plot for angina and pronethalol.
To Applied Biostatistics index.
To Martin Bland's M.Sc. index.
This page maintained by Martin Bland.
Last updated: 20 February, 2012.