Question 6: Compute the average of the square roots of the number of attacks on placebo adnd pronethalol and draw a scatter plot of difference against average. Do the difference and average after square root transformation appear to be related?
First we compute the average. Click Transform, Compute. Type a variable name into the Target Variable box. I used 'averagesr'. Now type or click '(' into the Numeric Expression box. Choose the Arithmetic Function Group, choose Sqrt and use the up arrow to put it into the Numeric Expression box. Replace the '?' symbol in the brackets by variable 'placebo', type or click '+', put 'Sqrt' into the Numeric Expression box, and put the variable 'proneth' where the question mark is. then type or click ')/2'. You should now have '(SQRT(placebo) + SQRT(proneth)/2' in the Numeric Expression box. Click OK.
Before drawing the graph, I gave this new variable a label in Variable View. I used 'Average, square root number of attacks'.
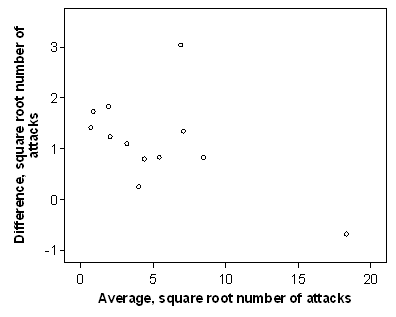
Click Graphs, Legacy Dialogs, Scatter/Dot, Define. Put the variable 'Difference, square root number of attacks' into the Y Axis box and 'Average, square root number of attacks' into the X Axis box. Click OK.
You should get the following graph, after changing the text size, scale, number format, etc.:

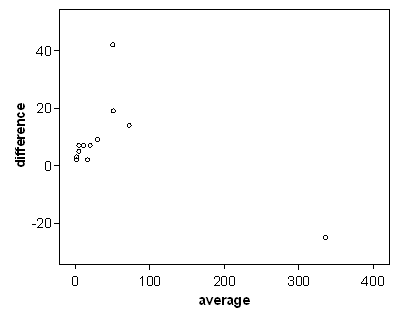
If we put the two scatter plots side by side we get:


The plot for the square root transformed data shows a less strong relationship between difference and average than does that for the untransformed raw data, though some relationship is still apparent.
Back to Exercise: Normal plot for angina and pronethalol.
To Applied Biostatistics index.
To Martin Bland's M.Sc. index.
This page maintained by Martin Bland.
Last updated: 20 February, 2012.