Question 5: Do you think the PEF measurements themselves follow a Normal distribution?
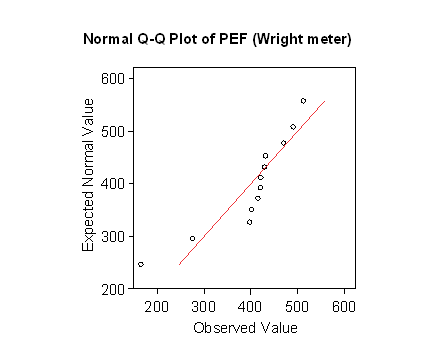
The Normal plot for the PEF as measured by the Wright meter looks like this:

This has a clear upwards curve, being above the straight line at the low end, below the line in the middle, and above the line at the top.
The data do not appear to follow a Normal distribution, but to be negatively skew.
The plot for the mini meter is similar.
Note that the paired t test does not need the two variables being differenced to be Normal, only the differences themselves.
These women varied greatly in age. Most were in their twenties, two were middle aged, and one was fairly elderly. This produced the negative skewness, PEF for women of similar ages would follow a Normal distribution.
Back to Exercise: Comparing peak flow meters.
To Applied Biostatistics index.
To Martin Bland's M.Sc. index.
This page maintained by Martin Bland.
Last updated: 20 February, 2012.