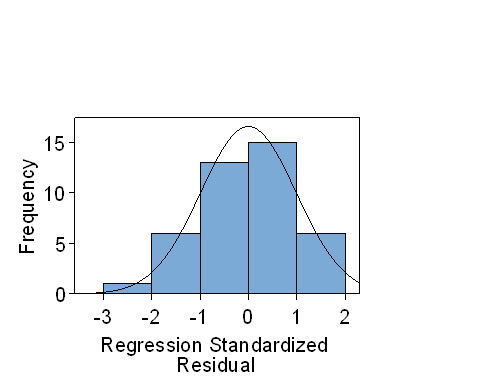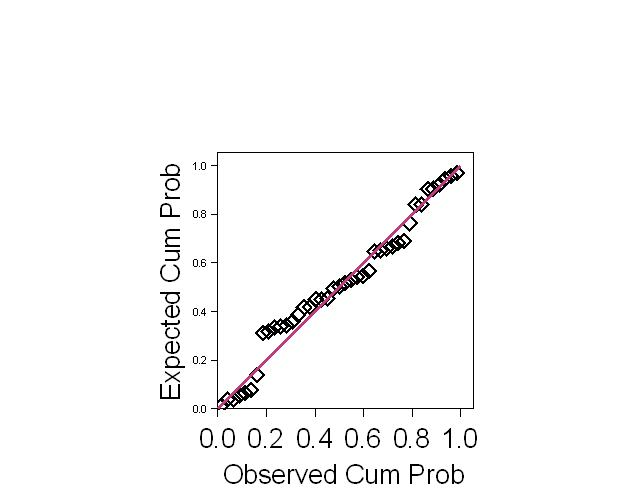
Question 5: Plot a histogram and Normal plot for the residuals.
We do this via the regression command.
Click Analyze, Regression, Linear. Select Quadriceps strength into Dependent and Height into Independent. Make sure that Method is Enter. Click Plots, click Histogram, Click Normal probablity plot. Click Continue. Click OK.
You should get the following graphs:


I have improved both of these graphs by increasing the size of text, deleting things I did not want, etc.
The histogram is roughly symmetrical and the Normal plot is roughly straight, so the assumption of a Normal distribution appears quite plausible.
Back to Exercise: Muscle strength, age and height for alcoholic men.
To Applied Biostatistics index.
To Martin Bland's M.Sc. index.
This page maintained by Martin Bland.
Last updated: 4 December, 2006.