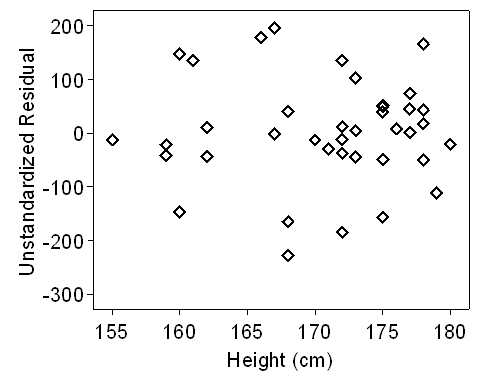
Question 6: Plot the residuals against height. Does there appear to be any non-linearity?
We do this via the regression command.
Click Analyze, Regression, Linear. Select Quadriceps strength into Dependent and Height into Independent. Make sure that Method is Enter. Click Save. Under Residuals, click Unstandardized, Click Continue. Click OK.
You should find that a new variable has been added to your data set, called "RES_1" and labeled "Unstandardized Residual".
Now we draw the scatter diagram. Click Graphs, Legacy Dialogs, Scatter/Dot, Simple Scatter, Define. Select Unstandardized Residual into Y-axis and Height into X-axis. Click OK.
I have improved the graphs by increasing the size of text, etc.
There does not appear to be any relationship between residual and height, so there is nothing to suggest that the relationship between strength and height is not linear.
Back to Exercise: Muscle strength, age and height for alcoholic men.
To Applied Biostatistics index.
To Martin Bland's M.Sc. index.
This page maintained by Martin Bland.
Last updated: 21 february, 2012.