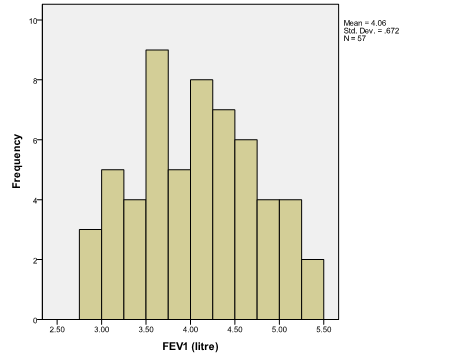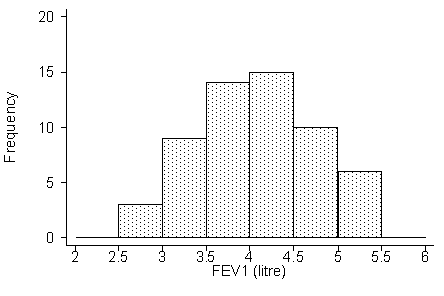
Question 1: Using SPSS, produce a histogram of FEV1. Compare it to the one used in the lecture.
To do this we choose Graphs, Legacy Dialogs, Histogram, variable FEV1, OK.

If we compare this to the histogram used in the lecture:

we have different interval size and the text is very small.
Back to Exercise: Histogram of FEV1 data.
To Applied Biostatistics index.
To Martin Bland's M.Sc. index.
This page maintained by Martin Bland.
Last updated: 16 January, 2012.