 d
d
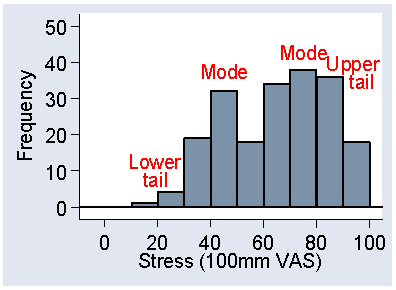
Question 3: Where are the mode, the lower tail and the upper tail of this distribution?
The mode is the value of the variable at highest part of the graph, the region of highest frequency. This is where stress is between 70 and 80 mm. There appears to be a second mode between 40 and 50 mm. This could be a bimodal distribution.
The lower tail is the part of the distribution where there are relatively few observations and these are small. This is where the VSA stress is below 30 mm.
The upper tail is the part of the distribution where there are relatively few observations and these are large. This is where the VSA stress is above 90 mm. This distribution has a very short upper tail.
This is how they look on the histogram:
Back to Exercise: VAS stress from the 2005 questionnaire.
To Applied Biostatistics index.
To Martin Bland's M.Sc. index.
This page maintained by Martin Bland.
Last updated: 9 October, 2006.