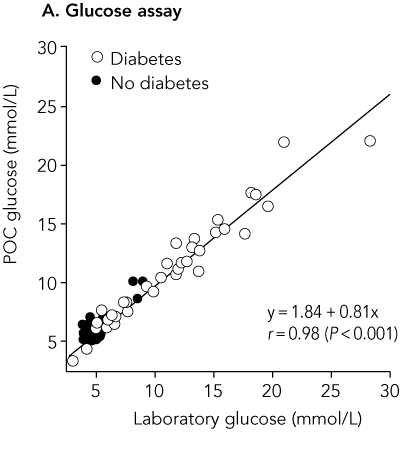
Question 4: How are the effects of the sampling method shown in the scatter diagram for glucose?

The sampling method drops everyone below 5.5 mmol/L who is not diabetic. This is clearly seen in the diagram. Low glucose measurements are missing for non-diabetic subjects. The only measurement below 5 mmol/L are those for a couple of diabetic subjects.
Back to question.
This page maintained by Martin Bland.
Last updated: 1 March, 2007.