 D
D
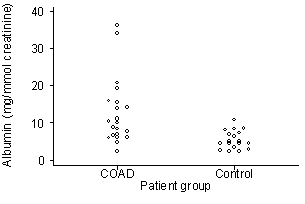
In a study of renal function in chronic obstructive airways disease (COAD), urine samples were collected from 21 COAD patients and 18 healthy controls. Albumin excretion by COAD patients and controls is shown in the figure below.
The difference was significant (t=3.5, P<0.001). All analyses were done using the logarithms of the observations. The estimate of the difference, COAD – control, on the loge scale was 0.720 (95% CI 0.344 to 1.096), which gives the antilog 2.05 (95% CI 1.41 to 2.99) (Wilkinson et al., 1993).
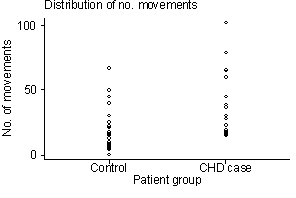
In a study of factors related to coronary heart disease, the prevalence of arm movements was compared in 25 consecutive attenders at a chest pain clinic who had coronary heart disease (CHD) and 25 consecutive attenders at a non-cardiac clinic. Patients were fitted with a goniometer, a device which records movement. Movements were recorded during 10 minutes of the consultation. The function of the goniometer was not explained to the patient until after the reading had been taken.
The arm movements are shown in the graph below:
The study found that the patients with CHD made more arm movements than the controls. This difference was statistically significant using a two sample t test (P=0.01) (Rennie 1997). (In fact, Rennie described his test as one-way analysis of variance, but this is exactly the same as a two sample t test using the pooled variance when there are only two groups.)
The table below shows concentration of antibody to Type II Group B Streptococcus (GBS) in 20 volunteers before and after immunization (Baker et al., 1980).
| Subject | GBS before | GBS after | Difference afterbefore |
|---|---|---|---|
| 1 | 0.4 | 0.4 | 0.0 |
| 2 | 0.4 | 0.5 | 0.1 |
| 3 | 0.4 | 0.5 | 0.1 |
| 4 | 0.4 | 0.9 | 0.5 |
| 5 | 0.5 | 0.5 | 0.0 |
| 6 | 0.5 | 0.5 | 0.0 |
| 7 | 0.5 | 0.5 | 0.0 |
| 8 | 0.5 | 0.5 | 0.0 |
| 9 | 0.5 | 0.5 | 0.0 |
| 10 | 0.6 | 0.6 | 0.0 |
| 11 | 0.6 | 12.2 | 11.6 |
| 12 | 0.7 | 1.1 | 0.4 |
| 13 | 0.7 | 1.2 | 0.5 |
| 14 | 0.8 | 0.8 | 0.0 |
| 15 | 0.9 | 1.2 | 0.3 |
| 16 | 0.9 | 1.9 | 1.0 |
| 17 | 1.0 | 0.9 | –0.1 |
| 18 | 1.0 | 2.0 | 1.0 |
| 19 | 1.6 | 8.1 | 6.5 |
| 20 | 2.0 | 3.7 | 1.7 |
The comparison of the antibody levels was summarized in the report of this study as t = 1.8; P>0.05.
You can use the following table to carry out the sign test. As described in topic 3, significance tests, we first need the sample size, which is the number of non-zero differences. We use this because zero differences give no information about the direction of the change. We then find the test statistic. This is the number of negative differences, or the number of positive differences if this is smaller. We then find the row in the table corresponding to our sample size. The difference is significant if the test statistic less than or equal to the critical value.
| Number of non-zero differences | Critical value for a two-sided test, 0.05 level |
|---|---|
| 5 | None |
| 6 | 0 |
| 7 | 0 |
| 8 | 0 |
| 9 | 1 |
| 10 | 1 |
| 11 | 1 |
| 12 | 2 |
| 13 | 2 |
| 14 | 2 |
| 15 | 3 |
| 16 | 3 |
| 17 | 4 |
| 18 | 4 |
| 19 | 4 |
| 20 | 5 |
Rennie, A.N. (1997) Prevalence of arm movements in patients with coronary heart disease: case-control study. British Medical Journal 314, 122.
Wilkinson, R., Milledge, J.S., and Landon, M.J. (1993) Microalbuminuria in chronic obstructive lung disease. British Medical Journal 307, 239.
Baker, C.J., Kasper, D.L., Edwards, M.S., Schiffman, G. (1980) Influence of preimmunization antibody levels on the specificity of the immune response to related polysaccharide antigens. New England Journal of Medicine 303, 173-8.
Questions adapted from Martin Bland and Janet Peacock: Statistical Questions in Evidence-based Medicine, Oxford University Press, Oxford, 2000, and Douglas Altman: Practical Statistics for Medical Research, Chapman and Hall, London, 1991.
To Introduction to Statistics for Clinical Trials index.
To Martin Bland's M.Sc. index.
This page maintained by Martin Bland.
Last updated: 27 July, 2009.