 d
d
Extract from Statistical Questions in Evidence-based Medicine by Martin Bland and Janet Peacock.
We hope that the topic will be useful in own right, as well as giving a flavour of the book.
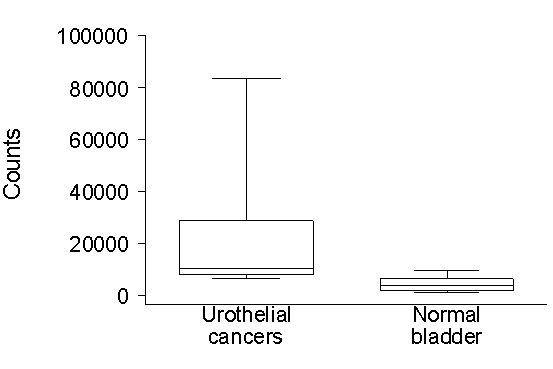
In a study of a possible diagnostic test for urothelial malignancies, responses obtained from cellular extracts from 8 patients with urothelial cancer and 28 controls with normal bladders were compared (Stoeber et al., 1999). A figure similar to this was presented:
+
1. What does the graph tell us about the shapes of the distributions?
Check answer 1
+
2. The groups were compared using an `equal variance t test'.
Do you think this approach is acceptable here?
Check answer 2
+
3. What possible approaches could be used to compare these groups?
Check answer 3
Reference:
Stoeber, K., Halsall, I., Freeman, A., Swinn, R., Doble, A., Morris, L.,
Coleman, N., Bullock, N., Laskey, R.A., Hales, C.N., and Williams, G.H. (1999)
Immunoassay for urothelial cancers that detects DNA replication protein Mcm5
in urine. Lancet 354, 1524-5.
Back to Statistical Questions in Evidence-based Medicine contents.
Back to Martin Bland's home page.
This page maintained by Martin Bland.
Last updated: July 1, 2005.