 d
d
Extract from Statistical Questions in Evidence-based Medicine by Martin Bland and Janet Peacock.
We hope that the topic will be useful in own right, as well as giving a flavour of the book.
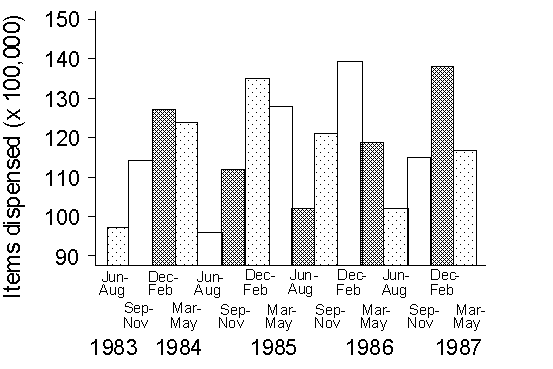
Many prescribed drugs show a seasonal pattern in their use. The following graph shows an example of this and is taken from routinely collected Prescribing Analyses and Cost (PACT) data (Heywood 1991):
1. What kind of graph is this?
Check answer 1
2. What feature of the graph might make it misleading?
Check answer 2
3. What feature of the graph makes it difficult to see the pattern?
Check answer 3
4. How could the graph be improved?
Check answer 4
Reference:
Heywood, P. (1991) PACT level 3 -- a tool for audit. Practitioner 235, 450-1.
Back to Statistical Questions in Evidence-based Medicine contents.
Back to Martin Bland's home page.
This page maintained by Martin Bland.
Last updated: June 30, 2005.