At St. George's we use two types of automatically marked question. We use multiple choice questions of the stem and 5 branch type, where each stem may be True or False, usually referred to as "MCQs". We use extended matching items questions, where there is a scenario and any number of questions with answers chosen from a long list, usually referred to as "EMIs". In our usual practice, MCQs have negative marking, i.e. you get +1 for a right answer and -1 for a wrong answer, and EMIs do not have negative marking.
In Term 3, 2002, a question of the EMI type is to be used.
Each branch is True or False.
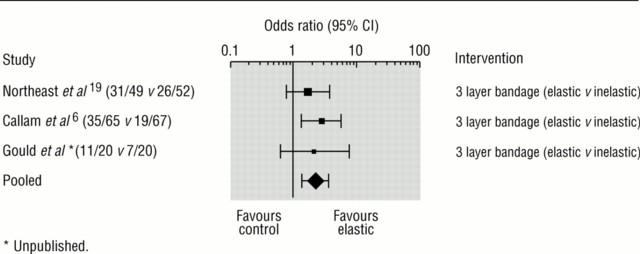
1. The following figure is taken from a paper entitled `A systematic review of compression treatment for venous leg ulcers', (BMJ 1997; 315: 576-580)
(a) The figure shows the results of a meta-analysis;
(b) The odds ratios are shown on a logarithmic scale;
(c) The horizontal lines represent confidence intervals;
(d) The study by Callam et al. shows a significant advantage for elastic
bandages;
(e) The study by Gould et al. should not be included because it is
unpublished.
2. Cross-over designs for clinical trials:
(a) may be used to compare several treatment;
(b) involve no randomization;
(c) require fewer patients than do designs comparing independent groups
(d) are useful for comparing treatments intended to alleviate chronic symptoms;
(e) use the patient as his own control.
3. In a systematic review of a treatment:
(a) we need a clear statement of the question;
(b) published studies can be found by computer literature search;
(c) all unpublished studies should be included;
(d) unpublished studies are likely to include larger treatment differences
than published ones;
(e) papers published in English should be given most weight in the analysis.
4. The following figure shows the results of a meta-analysis of trials comparing the addition of the drug salmeterol with increasing the dose of inhaled corticosteroids in poorly controlled asthma (BMJ 2000; 320: 1368-1373). The figure shows the difference in proportions of patients with one or more exacerbations of asthma. Positive differences indicate treatment benefit with addition of salmeterol:
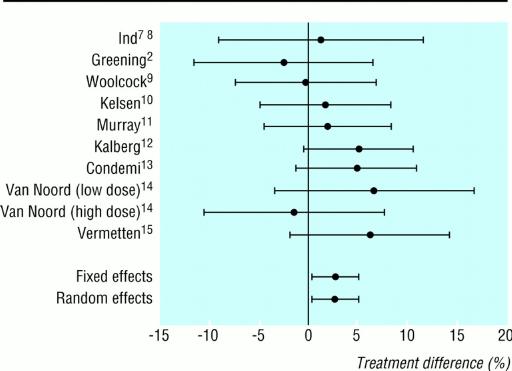
(a) the solid circles represent the observed differences for the trials;
(b) the horizontal lines represent confidence intervals;
(c) studies with long horizontal lines should be given most weight in the
meta-analysis;
(d) there is evidence that addition of salmeterol results in fewer
exaccerbations of asthma than does increasing the dose of inhaled
corticosteroids;
(e) none of the individual trials was big enough to detect the difference
which might exist between these two treatments.
A study was carried out of the effectiveness of antibiotic prophylaxis in critically ill adult patients. The objective was to determine whether antibiotic prophylaxis reduces respiratory tract infections and overall mortality in patients in intensive care (BMJ 1998; 316: 1275-1285).
Studies were identified through Medline and studies listed in previous meta-analyses. The organiser of the first European Consensus Conference on Intensive Care Medicine also provided a list of all investigators who had ever published on the topic. An additional search focused on proceedings of scientific meetings held on the subject and personal contacts were established with other known investigators.
The main outcome measures were respiratory tract infections and total mortality. The authors reported that analysis of the available trials indicated a strong significant reduction in infection (odds ratio 0.35; 95% confidence interval 0.29 to 0.41) and total mortality (0.80; 0.69 to 0.93). The following figure was produced for mortality:
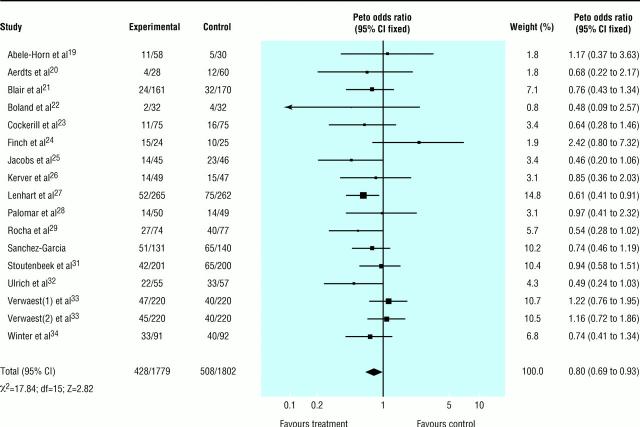
5. What type of study design and analysis is this?
6. What is the search strategy designed to prevent?
7. What kind of graph is this?
8. What kind of scale is used on the horizontal axis?
9. What does the area of the squares represent?
10. What does the position of the squares represent?
11. What do the horizontal lines represent?
12. What does the position of the diamond or lozenge shape represent?
13. What does the width of the diamond or lozenge shape represent?
14. How strong is the evidence for a difference in infection between the
two treatments?
a. assessment bias
b. bar chart
c. cohort study
d. confidence interval
e. forest plot
f. histogram
g. inter-quartile range
h. linear
i. line graph
j. little or no evidence
k. logarithmic
l. meta-analysis
m. moderate evidence
n. multiple testing
o. odds ratio for all studies combined
p. odds ratio for the study
q. P value
r. publication bias
s. randomised controlled trial
t. recall bias
u. regression analysis
v. relative risk for all studies combined
w. scatter diagram
x. standard error
y. study size
z. very strong evidence
Back to Research and Critical Skills Course Page.
This page maintained by Martin Bland.
Last updated 29 June, 2004.