The neurophysiology of the ear suggests that sensory information arriving at the basilar membrane can be described in terms of a spectrogram. That is, the initial information available to the auditory system is that visible in a spectrogram ( Bregman, 1990 ).
Listen to this simple auditory example:
![]()
The corresponding spectrogram of this simple sound (no background noise, masking or interfering sounds) looks like this:
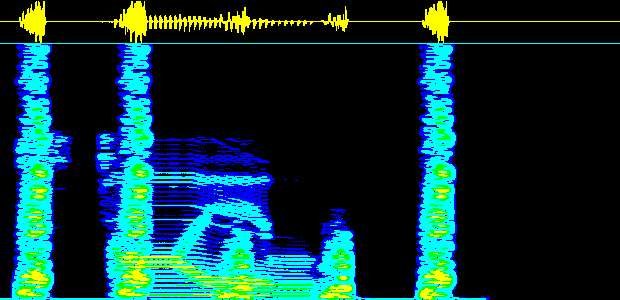
Note that the higher frequencies are not shown. The upper part (yellow) is the IFFT of the spectrogram (i.e. the sound wave over time).
Try to tell which parts of the spectrogram correspond to the spoken
message 'Style' and which to the sequence of noise-like sounds. You
might find this visual task not all that much easy, despite that the
sound is simple, and selectively attending to either of the constiuent
sounds (the noise-like sequence
![]() and the spoken message
and the spoken message
![]() ) is effortless.
) is effortless.
What the auditory system has achieved while you were selectively attending to either of the two constituent sounds in this example, is the decomposition of the above spectrogram, into the two following ones:
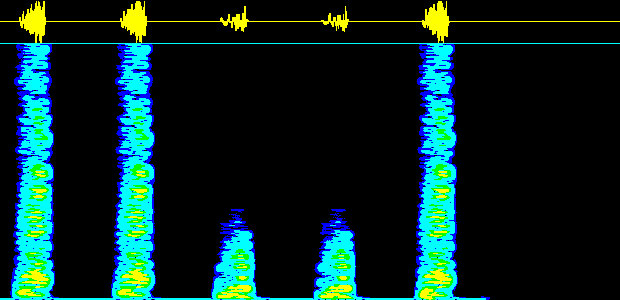
the noise-like sequence

and the spoken message.
It is fascinating that the auditory system can effortlessly (and most
of the time successfully) identify the constituent sounds in much more
complex sounds. Can you spot the "hey" sound
![]() ,
when it is mixed with music?
,
when it is mixed with music?

"hey" sound
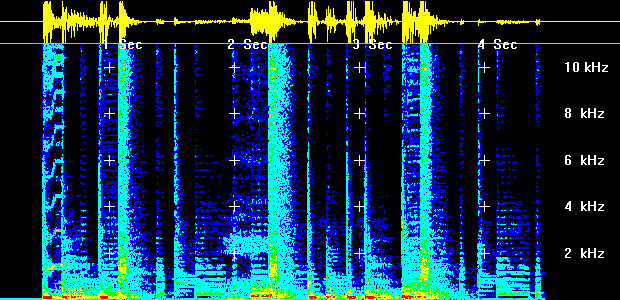
"hey" sound with music
Not very easy, is it? Perhaps you'd like your auditory system to
do this task for you:
![]()
References
![]() Back to Evangelos's Research Page
Back to Evangelos's Research Page