 d
d
Question 4: How could the graph be improved?
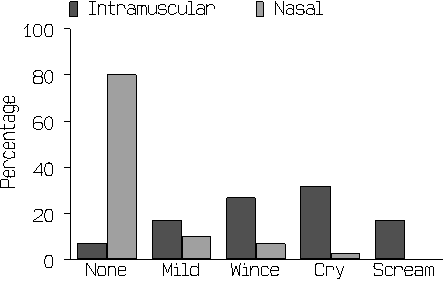
What we want to see is the proportions showing each reaction:
This shows much more clearly that about 20% of the intramuscular group screamed and none of the nasal group. If we want a cumulative graph, which I donít think we do, we should start with screamed, then screamed or cried, then screamed or cried or winced, etc.:
Now the third pair of bars show the percentage who winced or worse.
Back to Exercise: Nasal diamorphine.
To Applied Biostatistics index.
To Martin Bland's M.Sc. index.
This page maintained by Martin Bland.
Last updated: 20 October, 2006.