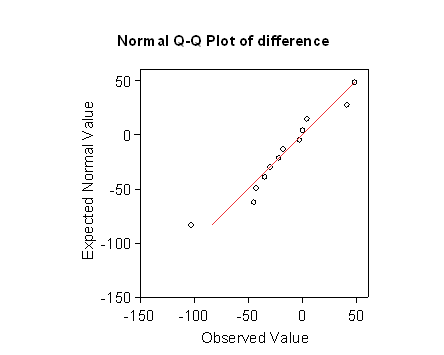
Question 2: Compute the differences in measured PEF and draw a Normal plot (Q-Q plot). Does the distribution look Normal?
First we compute the difference. Click Transform, Compute. Type a variable name into the Target Variable box. I used 'difference'. Now put the variable 'PEF (Wright meter)' into the Numeric Expression box, type or click '-', and put the variable 'PEF (mini meter)' into the Numeric Expression box. You should now have 'wright - mini' in the Numeric Expression box. Click OK.
We now draw the Normal or Q-Q plot. Click Analyze, Descriptive statistics, Q-Q plots. Choose variable 'difference'. Click OK.
I have increased the size of the text on the graph and improved it in various ways:

There does not appear to be a systematic deviation from the Normal distribution, though there does appear to be a rather extreme difference.
Back to Exercise: Comparing peak flow meters.
To Applied Biostatistics index.
To Martin Bland's M.Sc. index.
This page maintained by Martin Bland.
Last updated: 20 February, 2012.