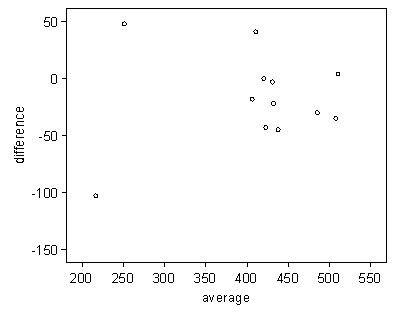
Question 3: Compute the average PEF using the two meters and draw a scatter plot of difference against average. Do the differences and averages of the numbers of attacks appear to be related?
First we compute the average. Click Transform, Compute. Type a variable name into the Target Variable box. I used 'average'. Now type or click '(' into the Numeric Expression box, put the variable 'PEF (Wright meter)' into the Numeric Expression box, type or click '+', put the variable 'PEF (mini meter)' into the Numeric Expression box, and type or click ')/2'. You should now have '(wright + mini)/2' in the Numeric Expression box. Click OK.
Click Graphs, Legacy Dialogs, Scatter/Dot, Define. Put the variable 'difference' into the Y Axis box and 'average' into the X Axis box. Click OK.
You should get the following graph, after changing the text size, scale, number format, etc.:

The variability and mean of the differences do not appear to change with the average, though there does appear to be a point with a much larger difference than the rest.
Back to Exercise: Comparing peak flow meters.
To Applied Biostatistics index.
To Martin Bland's M.Sc. index.
This page maintained by Martin Bland.
Last updated: 20 February, 2012.