20 June 2007
Question
In the Jackson paper why in Table 3 do they use weighted Kappa for the SPIN only and intraclass correlations for the others?
Answer
SPIN has a few ordered categories so weighted kappa is approriate. The other scales are numeric and are treated as quantitative.
20 June 2007
Question
Is Spearmanís rho appropriate for measures of agreement between tests when the tests use different numerical scales, (e.g. 0-5, 0-10 and 0-100)?
Answer
Spearman's rho is a correlation coefficient and so cannot measure agreement. We could not look at agreement in this case as the scales are all in different units. We are asking whether the two measurements are related, which Spearman's rho does.
20 June 2007
Question
In the Jackson paper, why have they have used the Spearman's rank correlation coefficient? I understand that correlation is inappropriate for the study of agreement between different methods of measurement, which is about whether the measurement methods can be used interchangeably.
Answer
They are not measuring agreement in the sense on interchangeability, because the measures are not in the same units. They are asking whether the measures are related. It is a validity question.
20 June 2007
Question
In the Jackson paper, should the Spearman's coefficients have confidence intervals?
Answer
So far as I know, there is no simple method for calculating a confidence interval for Spearman's rho and most software doesn't do it. Hence they would not have a confidence interval available. A very complicated method was published a few years ago (Computational Statistics and Data Analysis 2000; 34: 219-241). Some people use the same method as we use for the product moment correlation coefficient, but the correctness of the approximation is in doubt. Of course, I would not expect students on this course to be aware of any of this.
20 June 2007
Question
In the discussion of the Jackson paper it states that "The lower percentage agreement for present pain intensity was found for all scales and is likely to reflect its fluctuating nature; indeed,several participants commented that their pain had worsened on sitting during the study", and yet they only used the first set of measurements in the analysis as the "results were similar for both first and second ratings".
This sounded contradictary to me, i.e. the second set for present pain would appear to have higher scale ratings for some particpants and therefore the mean of the measurements should be used and not just one set of measurments.
Answer
They used only the first measurement because they are interested in measuring the pain at that instant, not the average pain experienced over a period. In measurement studies, we should use the measurement exactly as it would be used in practice, here as a single measurement.
They could carry out a more complicated analysis to use pairs of measurements, but they may not have known how to do this.
20 June 2007
Question
The middle plot (sunflower) is very confusing! What does it mean?
Answer
I have not come across the "sunflower plot" before. The problem is that they have a lot of subjects who have the same values for both measurements. In a simple scatter plot, as done in SPSS, for example, these subjects would all be plotted at the same place on the graph. You would see only one point. The sunflower plot shows a single point as a little circle, a double point as two line radiating from the circle, a triple point as three lines, etc. Quite clever, really.
19 June 2007
Question
In the Dissanayaka paper, I am confused about the population they have selected as they appear to talk about both depressed and non depressed subjects, the depressive disorder versus major depression. Which is it?
Answer
My understanding is that subjects are depressed if they are positive for major or minor depression or dysthymia. They also look at the detection of major depression only.
19 June 2007
Question
In the Dissanayaka paper, am I right in thinking this is not a random sample and therefore not representative of the population?
Answer
It is not a random sample. The population here is people with Parkinson's disease and these are drawn from only two centres in one city. However, we usually think such samples are OK for looking at relationships between variables within the sample, e.g. here between Hamilton and DSMIV, but not so good for producing population estimates such as the proportion who are depressed.
19 June 2007
Question
In the Jackson paper, am I right in thinking this is not a random sample and therefore not representative of the population?
Answer
You are.
19 June 2007
Question
In the Jackson paper, is thematic analysis the same as factor analysis or just a 'cheaper version' or neither?
Answer
Thematic analysis is a qualitative research technique and completely outside our course.
19 June 2007
Question
In the Jackson paper, they don't mention how they scored the 'intermediate' scales, i.e. between 4 and 5 on the scale. Should this be mentioned for Kappa weighting or should I just forget about this?
Answer
They specifically say that scores made between scale points were excluded. This sounds very dubious to me!
19 June 2007
Question
In the Jackson paper, are the confidence intervals for ICC and kappa which have the upper limit greater than 1.00 incorrect? I thought they could not be more than 1 (perfect agreement).
Answer
Yes, they are incorrect. Confidence intervals should not include impossible values.
19 June 2007
Question
In the Jackson paper, wouldn't limits of agreement be a better methodology?
Answer
No, the measurements are all in different units, so they are not measurements of the same thing in the limits of agreement sense.
19 June 2007
Question
Would a sample of 72 be classed as small?
Answer
As measurement studies go, it is quite big, but in statistical terms it is small. We cannot ignore distributions.
18 June 2007
Question
Can you explain a bit more about systematic bias.
Answer
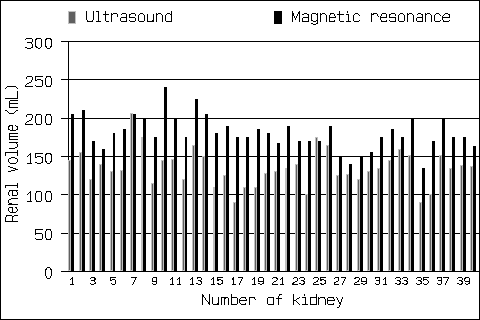
Systematic bias means that the average measurement by one method, one observer, or at one time is greater than or less than the average measurement by another method, another observer, or at another time. For example, in the study of Bakker et al. described in "Applying the Right Statistics: Analyses of Measurement Studies" in Week 3, the magnetic resonance measurement is greater than the ultrasound measurement for almost all subjects:

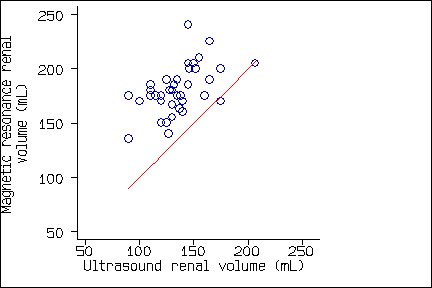
The first graph is how Bakker et al. published it. The next, which shows the magnetic resonance measurement on the vertical axis and the ultrasound measurement on the horizontal axis, shows nearly all the points on the same side of the line of equality, another way of illustrating the systematic bias:

18 June 2007
Question
In the paper on muscle strength testing they have used limits of agreement to analyse the test retest reliability of a muscle strength test.
My limited understanding of the 95% limits of agreement are that this is usually used to compare a new methodology with an old one. In this paper I cannot see how they are comparing different methods but different groups using the same method. Have I got this wrong?
Answer
Your understanding is correct. They have treated the first and second session as if they were two different methods. This enables them to estimate the systematic bias between the two sessions, which they interpret as possibly the effect of training in the measurement procedure or to changes in motivation.
18 June 2007
Question
In the paper on muscle strength testing, why would they combine the groups in analysis?
Answer
I do not think they should have combined the groups in the analysis. They have done it to increase the number they are analysing, but I don't think that what they have is representative of any population. It would be better to keep them separate.