Question 1: What is a ROC curve?
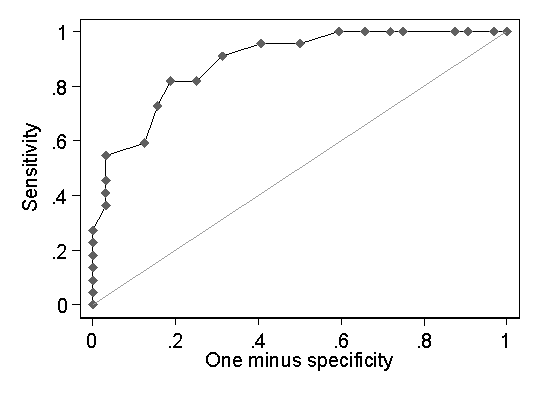
A ROC curve (or receiver operating characteristic curve) is a plot of sensitivity against specificity, or, more often, sensitivity against one minus specificity.
This example is a ROC curve for the use of different cut-off values on the HADS scale for the detection of anxiety or depression as diagnosed at a clinical interview in arthritis patients:

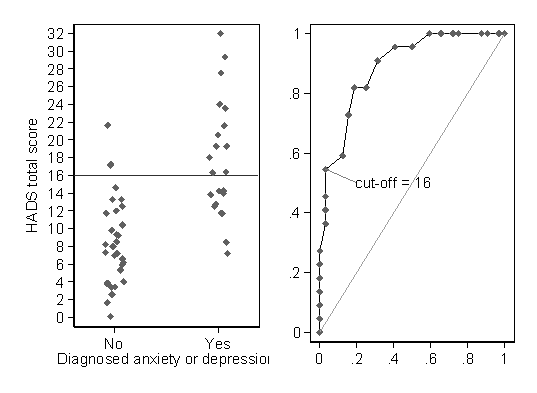
We can draw this when we have several possible tests with different combinations of sensitivity and specificity. The typical case is when we have a numerical scale and different cut-off values can be used.
As the cut-off changes, the proportion of subjects detected will change and so the sensitivity and specificity will change also. The following graph illustrates this for the HADS scale.

What the authors of this paper have done is to used different cut-offs on their Spanish version of the MIS, starting with the maximum possible value and going down to the minimum possible value, calculating the sensitivity and one minus specificity for each cut-off. They then plotted one against the other.
Back to question.
Back to Measurement in Health and Disease index.
This page maintained by Martin Bland.
Last updated: 2 March, 2007.