Question 2: What does the area below the ROC curve tell us? What can we conclude from area = 0.92?
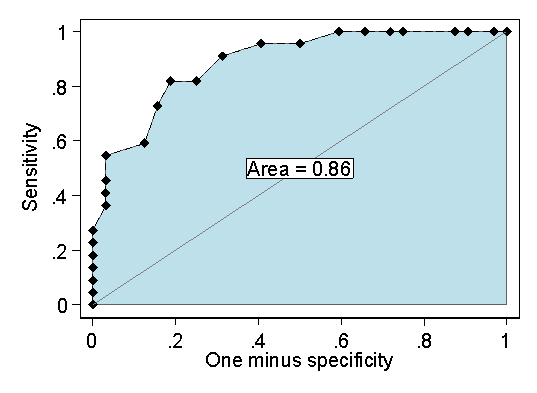
The are underneath the ROC curve is the area between the horizontal axis (sensitivity = 0 line) and the line joining the points for sensitivity and one minus specificity.
This is the area for the HADS example::

If the test has no ability to discriminate between people with and without the disease we wish to diagnose, the ROC curve will be a straight line between the points given by one minus specificity = 0 and sensitivity = 0, and by one minus specificity = 1 and sensitivity = 1. This shown on the diagram. The area under this is 0.5.
The bigger the area under the ROC curve, the closer it will be to the top lefthand corner and the better the test will be. The maximum value is 1.00, which would mean that there was a cut-off which would discriminate perfectly between disease postive and disease negative people. For the HADS data this is clearly not the case.
The area under the curve has a direct interpretation. It is the probablity that if a disease positive subject and a disease negative subject are measured, the disease positive subject will have a higher measurement than the disease negative subject (assuming that high values indicate disease, as in these examples).
In the dementia study, the area under the curve was quite high, 0.92. This indicates quite good discrimination and that the probability that a demented patient will have a higher score than a non-demented subject is 0.92.
Back to question.
Back to Measurement in Health and Disease index.
This page maintained by Martin Bland.
Last updated: 2 March, 2007.