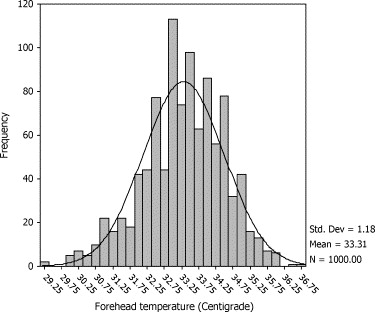
Question 6: What measurement problem does the histogram show?

The histogram shows digit preference. The bars show a clear up down up down pattern. The lower bars are the ones with the scale marked as 32.75, 33.25, 33.75, etc. The higher bars are in between and represent 32.50, 33.00, 32.50, etc. It appears that temperatures are more likely to be recorded to the nearest half degree.
Back to question.
Back to Measurement in Health and Disease index.
This page maintained by Martin Bland.
Last updated: 2 March, 2007.