 D
D
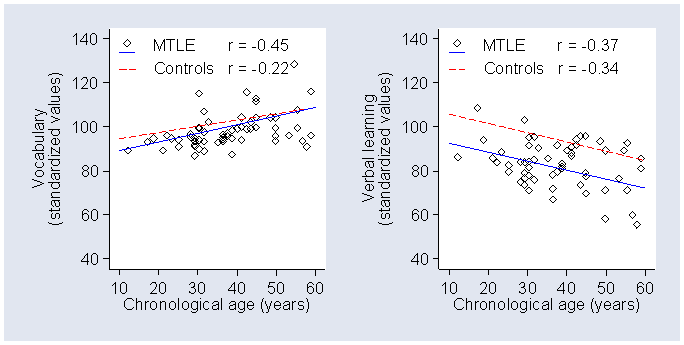
A graph similar to the following appeared in a study of epilepsy and psychological function. Scores on two psychological tests are plotted against age for 63 epileptic patients, with regression lines. For 125 controls, the regression lines of score on age are given, but not the individual data points (Helmstaedter and Elger 1999).
1. What kind of graphs are these?
2. What is a regression line?
3. What does “r = –0.34” mean?
5. All the correlations are significantly different from zero. What can we conclude about the relationships between psychological test performance and age?
6. What can we conclude about the differences in psychological test performance between epileptics and controls?
Reference
Helmstaedter C. and Elger C.E. (1999)
The phantom of progressive dementia in epilepsy.
Lancet 354, 2133-4.
Adapted from Martin Bland and Janet Peacock: Statistical Questions in Evidence-based Medicine, Oxford University Press, Oxford, 2000.
To IAPT index.
To Martin Bland's M.Sc. index.
This page maintained by Martin Bland.
Last updated: 2 March, 2009.