We have already seen in Sample size for clinical trials that there is a relationship between:
If we know three of these we can calculate the fourth.
ƒ(α,P) depends on power and significance level only.
| P | α | |
|---|---|---|
| 0.05 | 0.01 | |
| 0.50 | 3.8 | 6.6 |
| 0.70 | 6.2 | 9.6 |
| 0.80 | 7.9 | 11.7 |
| 0.90 | 10.5 | 14.9 |
| 0.95 | 15.2 | 20.4 |
| 0.99 | 18.4 | 24.0 |
Usually we choose the significant level to be 0.05 and P to be 0.80 or 0.90, so the numbers we actually use from this table are 7.9 and 10.5.
We can then choose the difference we want the trial to detect, δ, and from this work out what sample size we need.
Back to top.
Comparison of two means
We saw that to compare the means of two samples, sample sizes n1 and n2, from populations with means μ1 and μ2, with the variance of the measurements being σ2.
We have d = μ1 – μ2 and

so the equation becomes:

For equal sized groups, n1 = n2 = n, the equation becomes:

Back to top.
Unequal sample sizes
What about unequal sample sizes?
Define the allocation ratio = n1/n2 where n1 exceeds n2.
What is the effect of changing the allocation ratio?
Suppose we have a fixed total sample size = 1000,
and power = 0.9, alpha = 0.05.
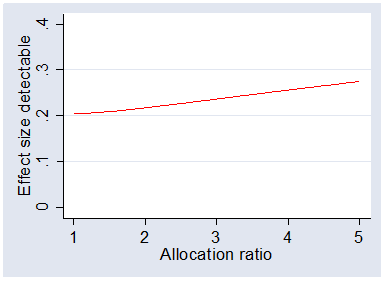
The following graph shows the effect size detectable with power 0.90 plotted against the allocation ratio.
When the allocation ratio is 1, there would be two samples of size 500, when the allocation ratio is 2
there would be a sample of 333 and one of 667, and so on:

We can see that equal allocation is most efficient, where the smallest difference, 0.205, can be detected. The fall in efficiency is not great as the allocation ratio increases. Even at allocation ratio = 5, samples of 167 and 833, the detectable difference is 0.275.
What if we fix the size of the difference to be detected?
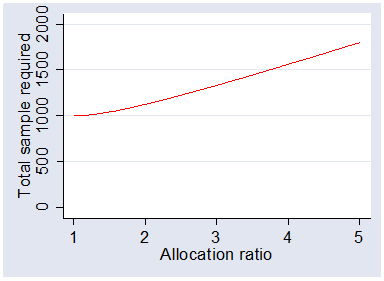
The following graph shows the total sample size required to detect the effect size as detectable
by two equal samples of size 500, 0.205, with power = 0.9, alpha = 0.05, plotted
against allocation ratio.

Again we can see that equal allocation is most efficient. Total sample size required rises only slowly, however, from 1000 at equal allocation to 1800 at an allocation ratio of 5 to 1.
Back to top.
Considerations in deciding the allocation ratio:
Several considerations can influence the decision about the allocation ratio:
Unequal allocation is not a panacea. We cannot reduce numbers on one treatment greatly without loss of power.
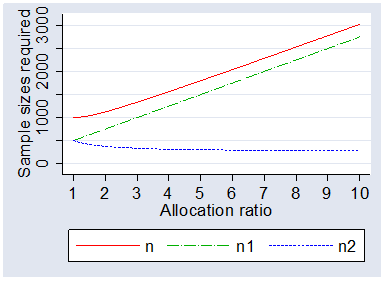
The following graph shows the total sample size and the size in each group
required to detect the effect size as detectable
by two equal samples of size 500, 0.205, with power = 0.9, alpha = 0.05, plotted
against allocation ratio.

Even with 10:1 allocation, the smaller group size is 275, just over half the number it would need for equal allocation. Half the original group size is the lowest possible limit to preserve power.
To Martin Bland's M.Sc. index.
This page maintained by Martin Bland.
Last updated: 23 July, 2009.