 d
d
Extract from Statistical Questions in Evidence-based Medicine by Martin Bland and Janet Peacock.
We hope that the topic will be useful in own right, as well as giving a flavour of the book.
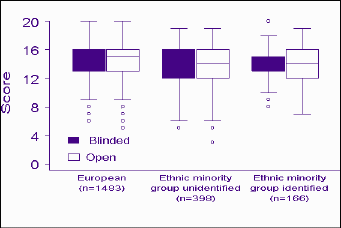
In a study of the relationship between ethnic group of applicants for medical school and rating of application forms, forms were given to assessors either open as sent or with the name and other ethnic group cues obliterated, so that assessment was blind. The forms were scored out of 20 for suitability for interview, a different assessor rating the masked and open forms for the same applicant. Ethnic group was classified (by different observers) from the form as either European, unidentified ethnic minority, or identified ethnic minority (Lumb and Vail 2000). The following figure was presented (thanks to Andy Vail for letting us have the data):
+
1. What kind of graph is this?
Check answer 1
+
2. In the plot, What do the five horizontal lines for each
group represent?
Check answer 2
+
3. What does the graph tell us about the shapes of the
distributions?
Check answer 3
+
4. What can we conclude from this figure?
Check answer 4
+
5. Why are there a number of observations shown as isolated
points?
Check answer 5
+
6. How could the data be plotted so as to take the paired
structure into account?
Check answer 6
+
7. What might such a plot obscure and what might it reveal?
Check answer 7
Reference:
Lumb, A.B. and Vail, A. (2000) Difficulties with anonymous shortlisting of
medical school applications and its effects on candidates with non-European
names: prospective cohort study. British Medical Journal 320,
82-5.
You can
read this paper on the BMJ website. Use your browser's back button
to return to this page.
Back to Statistical Questions in Evidence-based Medicine contents.
Back to Martin Bland's home page.
This page maintained by Martin Bland.
Last updated: June 29, 2005.