 d
d
Extract from Statistical Questions in Evidence-based Medicine by Martin Bland and Janet Peacock.
We hope that the topic will be useful in own right, as well as giving a flavour of the book.
Sperm concentration is found by counting the number of sperm in a small, fixed volume of semen, then multiplying by a constant to give an estimated count of sperm per litre of semen. Bromwich et al . (1994) studied the shape of the distribution of sperm concentration. They considered the Uniform, Normal, and Lognormal as possible shapes.
1. Which of these possible distributions do you think least likely for a
biological measurement?
Check answer 1
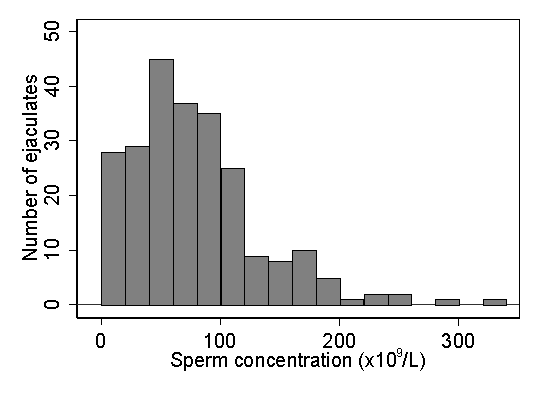
They gave the following histogram of sperm concentration in semen samples provided by men presenting for in vitro fertilisation:
2. What shape does this distribution have?
Check answer 2
+
3. The authors suggest that this distribution may be Lognormal. How
could graphical methods be used to investigate this?}
Check answer3
+
4. What type of distribution might counts be expected to follow?
Check answer 4
+
5. How might we investigate the fit to this distribution here,
remembering that the counts have been multiplied by an unknown constant?
Check answer 5
Reference:
Bromwich, P., Cohen, J., Steward, I., and Walker, A. (1994)
Decline in sperm counts: an artefact of changed reference range of "normal"?
British Medical Journal 309, 19-22.
You can
read this paper on the BMJ website. Use your browser's back button
to return to this page.
Back to Statistical Questions in Evidence-based Medicine contents.
Back to Martin Bland's home page.
This page maintained by Martin Bland.
Last updated: June 30, 2005.