 d
d
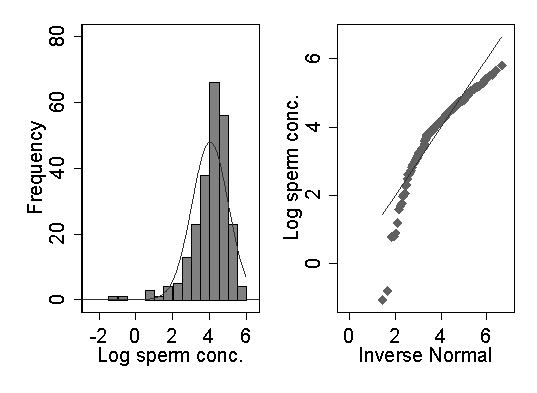
They could take the logs of the observations and plot a Normal distribution curve on the histogram. They could also construct a Normal plot of the log sperm concentrations. We have approximated their data from the histogram and done this for the log-transformed data. Clearly the log-transformed data are negatively skew and we do not have a Lognormal distribution:
This page maintained by Martin Bland.
Last updated: 5 July, 2005.