 d
d
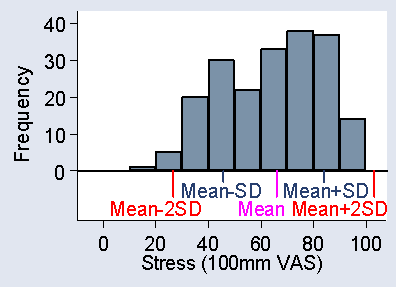
Question 3: How do the mean and standard deviation relate to the histogram?
We expect about 95% of observations to be within two standard deviations on either side of the mean and most observations to be within one standard deviation from the mean. Because of the negative skewness, the outlying observations will tend to be at the left end of the distribution.
The distribution looks like this:
Back to Exercise: VAS stress from the 2005 questionnaire, part 2.
To Applied Biostatistics index.
To Martin Bland's M.Sc. index.
This page maintained by Martin Bland.
Last updated: 13 October, 2006.