 d
d
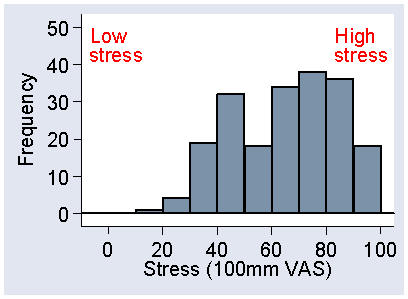
In this exercise we shall look at the stress data from the 2005 M.Sc. questionnaire. Stress was recorded on a 100 mm visual analogue scale (VAS) and has been reversed so that 0 means no stress at all and 100 means a lot of stress.
The following graph shows the distribution of the VAS stress reported by 200 respondents:
1. From the histogram, would you estimate the mean stress to be greater of less than the median? The median is 66 mm. What would you estimate the mean stress to be?
2. What would you estimate the standard deviation of VAS stress to be?
3. How do the mean and standard deviation relate to the histogram?
4. Approximately what would the variance of VAS stress be and in what units should it be reported?
To Applied Biostatistics index.
To Martin Bland's M.Sc. index.
This page maintained by Martin Bland.
Last updated: 13 October, 2006.