 d
d
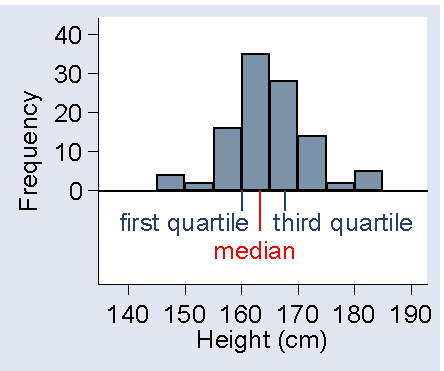
Question 6. From the graph, approximately what would you estimate the first and third quartiles to be? Where would they appear along the horizontal axis?
The first quartile, which cuts off the bottom quarter of the observations, appears to be about 160 cm. The third quartile, which cuts off the top quarter of the observations, appears to be around 170 cm, or just below. In fact, the first quartile is 160.0 cm and the third quartile 167.6 cm. Of course, it is difficult to judge accurately from the histogram and any answers within 2 cm of the correct one are good. My estimate of the third quartile was not very close.
This is how they look on the histogram:
Back to Exercise: Height from the 2005 questionnaire.
To Applied Biostatistics index.
To Martin Bland's M.Sc. index.
This page maintained by Martin Bland.
Last updated: 10 October, 2006.