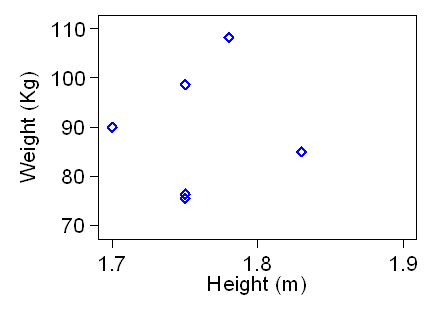
Sketch a graph to show the following (genuine) weights and heights of a group of men:
| Height (m) | Weight (Kg) |
|---|---|
| 1.75 | 76.4 |
| 1.70 | 90.0 |
| 1.78 | 108.2 |
| 1.75 | 98.6 |
| 1.83 | 85.0 |
| 1.75 | 75.5 |
Your graph should look something like this:

To Martin Bland's M.Sc. index.
This page maintained by Martin Bland.
Last updated: 2 October, 2007.