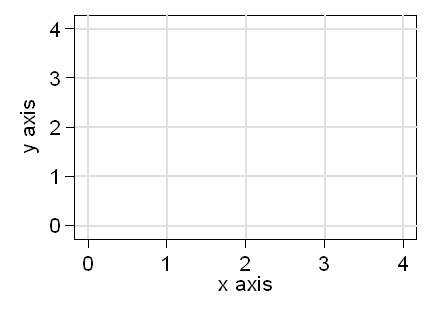
We often want to show data in the form of a graph. Usually, graphs have two axes, like this:

The horizontal axis is labeled "x-axis", a name which we often use for it. The vertical axis is labeled "y-axis". We often label the variables which are plotted on the x-axis and y-axis x and y. Mathematicians often put these in an italic font, so that they are easier to distinguish from the same letters being used in the words around them.
When we use a graph to show the relationship between two quantities, we usually put the variable whose effect we want to show on the horizontal x-axis and the variable on which we want to see the effect on the vertical y-axis.
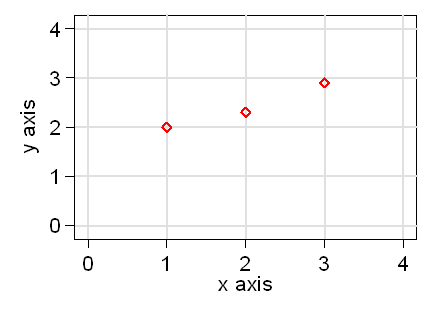
Suppose we want to plot a point on the graph. We will plot one for which the value of x is 1 and the value of y is 2. We find the value 1 along the x-axis. We draw a line vertically upwards. We find the value 2 along the y-axis. We draw a line horizontally across. Where these lines intersect is where we mark the point:
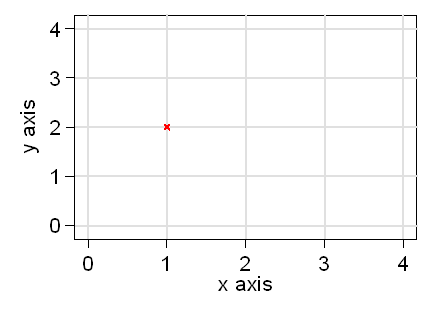
On this graph, these horizontal and vertical lines happen to be along the feint gridlines. On graph paper, they would be on the pre-ruled grid lines on the paper. Computers do them automatically and do not usually show them:
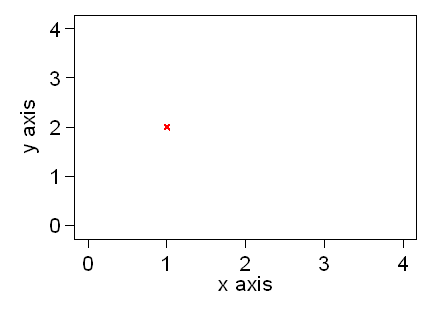
We will keep the gridlines for this illustration.
Now we will plot two more points, at x = 2 and y =2.3 and at x = 3 and y = 2.9:
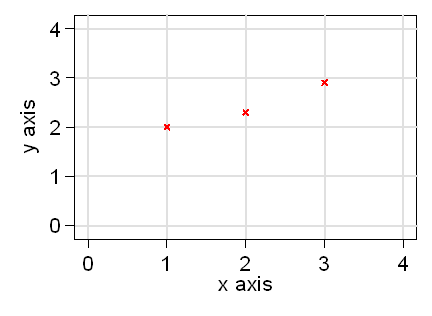
When we are plotting on graph paper, we usually use a cross as the symbol, because it is convenient and enables us to show the point accurately at the intersection of the two lines of the cross. Computers may use a variety of symbols for plotting: circles, squares, diamonds, etc. This is what we usually see in books and journals. For example, this is a diamond point symbol:
Sketch a graph to show the following (genuine) weights and heights of a group of men:
| Height (m) | Weight (Kg) |
|---|---|
| 1.75 | 76.4 |
| 1.70 | 90.0 |
| 1.78 | 108.2 |
| 1.75 | 98.6 |
| 1.83 | 85.0 |
| 1.75 | 75.5 |
Check answer to plotting points exercise.
The values of x and y for a point on a graph are called the coordinates. Sometimes this is hyphenated: co-ordinates. This indicates how it is pronounced. The coordinates of a point are shown like this (x-value, y-value). Hence the first man in the table above is plotted at coordinates (1.75, 76.4).
The point at coordinates (0,0) is called the origin of the graph.
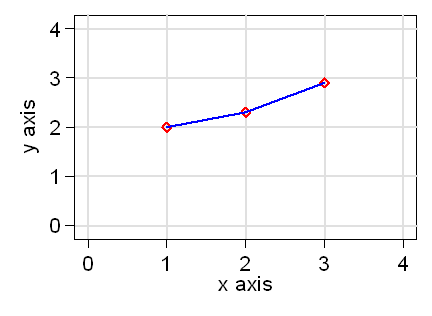
This only makes sense if the points are ordered in some way, usually when the x-axis variable is time. There would be no value in doing this for the heights and weights.
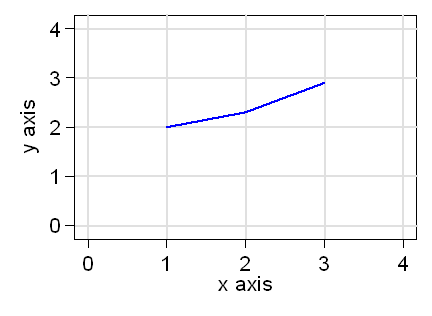
Sometimes the points are omitted altogether, just leaving the line:
Sketch a line graph to show the numbers of deaths associated with volatile substance abuse (VSA) in the UK between 1983 and 1999:
| Year | VSA deaths |
|---|---|
| 1983 | 82 |
| 1984 | 85 |
| 1985 | 117 |
| 1986 | 102 |
| 1987 | 116 |
| 1988 | 137 |
| 1989 | 113 |
| 1990 | 152 |
| 1991 | 122 |
| 1992 | 85 |
| 1993 | 79 |
| 1994 | 67 |
| 1995 | 77 |
| 1996 | 78 |
| 1997 | 78 |
| 1998 | 80 |
| 1999 | 73 |
Check answer to line graph exercise.
The following line graph does not represent health data, but an idealised relationship:
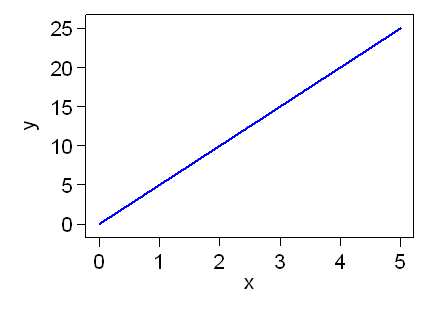
This shows a straight line, where the y variable is proportional to the x variable. We can see how this proportionality works by looking at how y changes with x. We can draw vertical lines one unit of x apart:

The vertical distance on the y scale between the points where these verticals meet our line is the increase in y for a one unit increase in x:
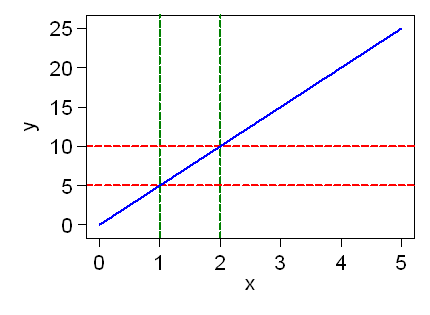
The increase is 5 units. We call this the gradient or slope of the line:
increase in y
slope = ––––––––––
increase in x
For this line, as x goes from 1 to 2, y goes from 5 to 10. We have
10 – 5
5
slope = ––––––
= –– = 5
2 – 1
1
The equation of the line is y = 5x.

This line goes through the point with coordinates (0,0), the origin. When x = 0, y = 0. Straight lines can be drawn in other places, too:
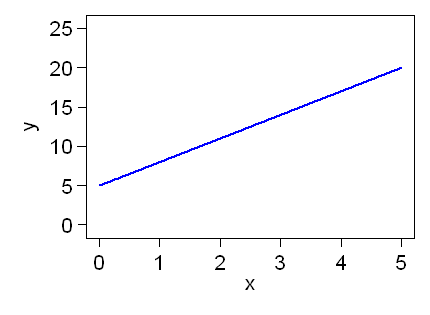
This line does not go through the origin. Its slope is 3, because y increases by 3 units when x increases by 1. It goes through the point (0,5), so when x = 0, y = 5. The equation of this line is y = 5 +3x:
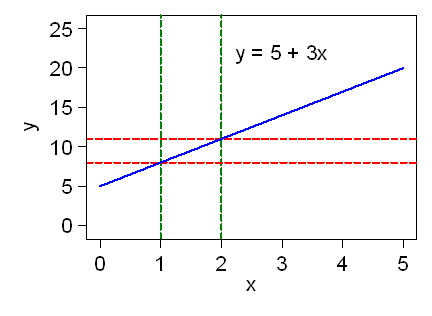
We call the value of y when x = 0 the intercept, because it is the value of y where the line crosses the y-axis, i.e when x = 0.
The general equation of a straight line is
y = intercept + slope × x
Mathematicians often write this as
y = c + mx
or the other way round as
y = mx + c
Just to be awkward, statisticians often write
y = a + bx
We call a and b, or m and c, the parameters of the line. They are numbers which tell us which of the many possible lines we have.
The parameters do not have to be positive.
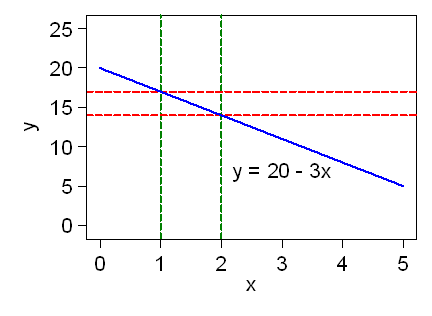
This line has a negative slope, where y decreases as x increases. We can see that when x = 1, y = 17, and when x = 2, y = 14.
increase in y
14 – 17
–3
slope = ––––––––––
= –––––––– =
––– = –3
increase in x
2 – 1
1
Exercise: straight line graphs
Sketch graphs of the following lines:
y = x
y = 2 + 0.5x
y = 5 – x
Check answer to straight line graphs exercise.
Back to Brush up your maths main menu.
To Martin Bland's M.Sc. index.
This page maintained by Martin Bland.
Last updated: 3 October, 2007.