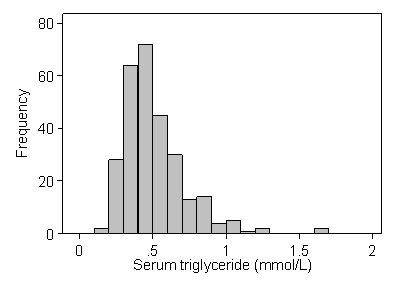
Question 2: Edit the graph to make it look like the following:
Text size 14 appeared to be about the same size as my graph.
Back to Exercise: Histogram of serum triglyceride data.
To Applied Biostatistics index.
To Martin Bland's M.Sc. index.
This page maintained by Martin Bland.
Last updated: 12 October, 2006.