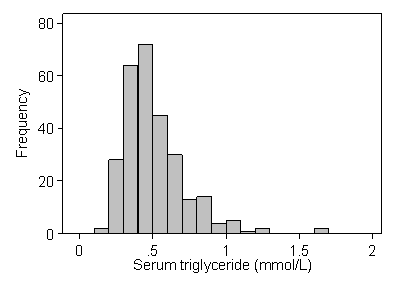
The file trig.sav contains the 282 serum triglyceride measurements (mmol/L) in cord blood used in the lecture.
Download the file and read it into SPSS.
1. Using SPSS, produce a histogram of serum triglyceride.
2. Edit the graph to make it look like the following:
Hints: You can change the legend for the horizontal axis by changing the variable label in the SPSS Data Editor, using the Variable View. When using the Chart Editor, it is best to change the interval start and width first.
3. Find the minimum, maximum, median, first and third quartiles,
and the 5th, 10th, 90th, and 95th centiles.
Report these to two decimal places.
4. Draw a box and whisker plot of the distribution.
5. Edit the box and whisker plot to increase the text size and change the colour.
Note that you can change the way the vertical axis is labeled by
using the scale option after you have clicked on the labels.
Make the scale run from 0 to 2 with an interval of 0.5.
To Applied Biostatistics index.
To Martin Bland's M.Sc. index.
This page maintained by Martin Bland.
Last updated: 17 October, 2006.